Elder Impulse system( EIS) is the combination of MACD and moving averages indicator. EIS indicator has 3 color bars, so using these 3 Types of the candle will show Bullish, bearish, and neutral trend.
This indicator has 3 types of bar( candle).
- The bullish bar represents a positive trend.
- the bearish bar represents a negative trend.
- the neutral bar represents when the market is not in a bullish or bearish trend.
EIS indicator is the all in one indicator of MA & MACD indicator. It’s a combined Moving Average Convergence Divergence (MACD) & Exponential Moving average (EMA) indicator.
Elder Impulse system Indicator Setting
Go to indicator Search section and search for ‘Elder Impulse System’.
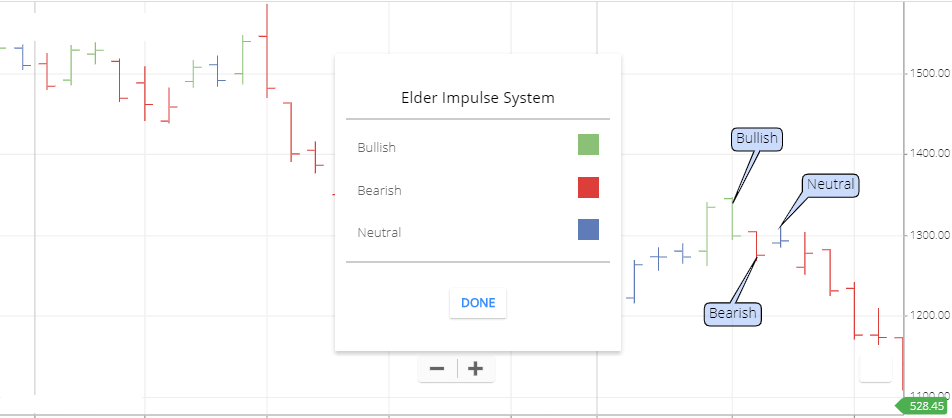
- Bullish: Bullish Trend Candle color.
- Bearish: Bearish Trend Candle Color.
- Neutral: No trend candle color.
Why Elder Impulse system Indicator is a combination of EMA & MACD indicators?
EIS indicator is the by default combination of MACD indicator and 13 periods EMA Line.
To know how the Elder impulse system Indicator works, You can use 13 periods EMA And use the MACD indicator (use MACD indicator by default settings).
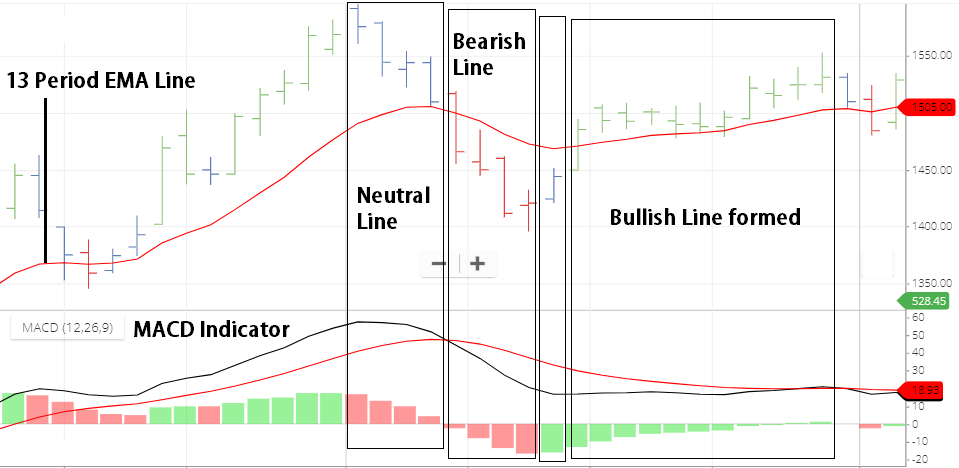
- See above chart, Bullish bar(Green bar) formed when, Price is above 13 periods EMA line & MACD Histogram Bar is green. Then bullish Line will be formed.
- Bearish line ( Red Line) formed when the price is below 13 periods EMA line & MACD Histogram bar is Red. Then the Red line will be formed.
- Neutral Line (Blue Line) formed when, Price is below 13 Period EMA line and Histogram bar is Green. In this situation, a neutral line will be formed.
- Also, Natural Line will be formed when the price is above 13 periods EMA line & Histogram Bar is Red. In this situation Neutral Line will be formed.
When Histogram Bar is green (means positive signal) but if the closing price is above 13 period EMA line ( this is the sign of positive trend). That’s why the EIS indicator shows a bullish line.
When the Histogram bar is Red ( means negative signal) but if the closing price is below 13 Period EMA line ( This is the sign of Negative trend). That’s why the EIS indicator shows Bearish Line.
But When the Histogram bar is green ( Means positive signal) but if the closing price is below 13 periods EMA Line (this is the sign of Negative trend). Then the EIS indicator will show Negative Line.
Also, when the Histogram bar is Red ( Means Negative signal) but if the closing price is above 13 period EMA line ( This is the sign of positive Trend). Then the EIS indicator will show a negative line.
Calculation
Elder Impulse System indicator formula is 13 Periods EMA Line & MACD Histogram. EMA shows a bullish & Bearish trend. The histogram shows price strength.
- So when both indicators are giving positive signals, then a bullish bar formed.
- When both indicators are giving a negative signal, then the bearish bar formed.
- When both indicator signal is opposite to each other, then the neutral bar will be formed.
Elder Impulse System Indicator Trading Strategy
- Forming of a Bullish line is the buying signal. But you can wait for the Next bullish line. Then you can buy stock in a second bullish line. Stop-loss can be a previous bullish line low point.
- When the Bearish line formed this is a sell signal. But you can wait for the next Bearish line. Then you can short sell shares in the second line. Stop-loss can be a previous bearish line high point.
Conclusion
The combination of Exponential moving average & Moving Averages Convergence Divergence is the Elder Impulse system indicator. It shows Bullish, Bearish & neutral price candles that will help to understand market Trends with buy and selling signals.
*Read Related Post for More information