Fractal Chaos Bands (FCB) is plotting on the price candle and tells you, the trendiness of the market.
Bands plotted on the high and low point with filtering out the small price movements.
FCB indicates the market is trending or sideways of the market. if the market is in bullish direction then bands will be the slope. Flat bands are the sign of sideways market.
What Fractal Chaos Bands tells you,
- The upper band formed by high point filtering Insignificant movement. So that for a short period of trading it’s helpful to see the upper price range.
- Similarly the lower band formed by the lowest point with filtering insignificant price movement. So that for a short period of trading it’s helpful to see a lower price range.
- It’s helpful to see the trending market when the market is trending the indicator will be the slope.
- Decreasing the slope of the band indicates the market is sideways.
- After the positive trendiness of the market if decreasing the slope of the band this is the sign market became volatile.
Setting
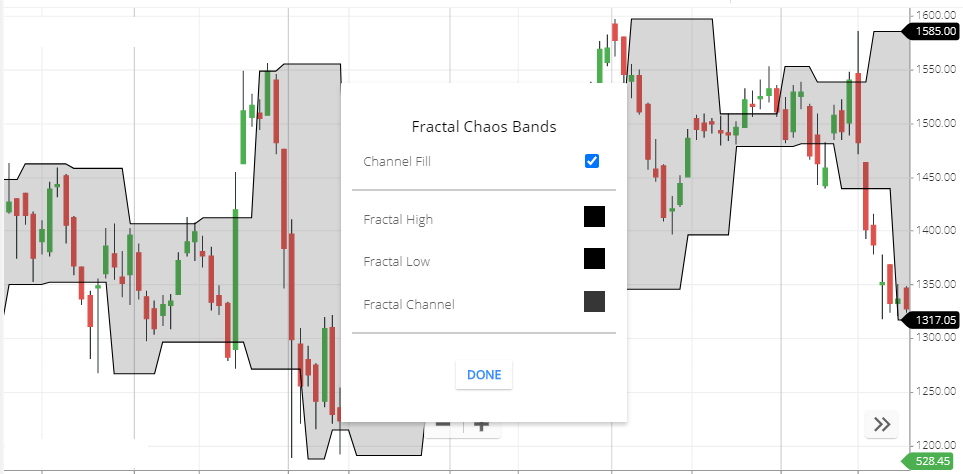
- Channel fill: this is for filling the channel by color. Channel Means the gap between the upper & Lower line.
- Fractal High: Upper Line color.
- Fractal Low: Lower Line color.
- Fractal Channel: this is the inside color between high and low bands. you can change the channel color anytime.
Fractal Chaos Bands trading strategy
- This indicator helpful for Intraday because FCB upper band plotted on the peak point & lower band plotted on the lowe point.with neglecting small price movement. So that for Intraday trading it’s will give an upper and lower price range. You can use the upper band as a Resistance and lower point as a support zone.
- For a long position, if the share price is rising then indicator will be the little slope. You can use Moving averages indicator with this. So that in trending market after crossing a specific period moving average line, you can buy.
- For short selling Position if share price falling then this indicator will be the little slope. combination of Moving averages with FCB indicator give you selling position. In the negative trend if share price break Moving averages line, then you can sell.
Conclusion
Fractal Chaos bands are helpful indicators to show the market is trending or not. this filter out small price movement and plotted on the price chart upper and lower portion. this indicator helpful for Intraday if the market is volatile so that you can buy & sell within a range.
Also helpful for finding the trendiness of the market, the indicator will be slope if the market is in trend. Flattering bands indicate the market is choppy.
*Read Related Post for more information.