Gopalakrishnan Range index indicates the variability of the stock price without using volume. GAPO is the log of n periods average of high & lows over the n time period.
In the specific time period if the market high and the low price difference is higher compared to the previous period. then the indicator line will rise up. this means compared to the previous specific period, the last specific period highest high and lowest lows price gap is high.
Throughout the whole article, I will use this indicator as a GAPO or GRI.
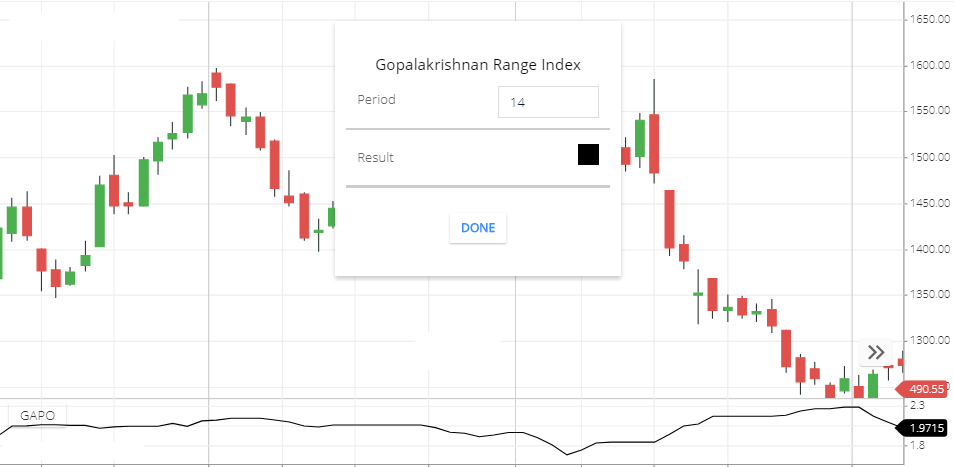
Indicator Setting
Gopalakrishnan Range Index Calculation
The formula of GAPO is= log(highest high price of the n period – lowest low price of the n period)÷log(n period).
Here, is the number of periods. you can set a number of periods while you set up this indicator. by default, the period value is 14. Also the highest high price means, within the 14 periods peak point and lowest low means, lowest price point within 14 Periods.
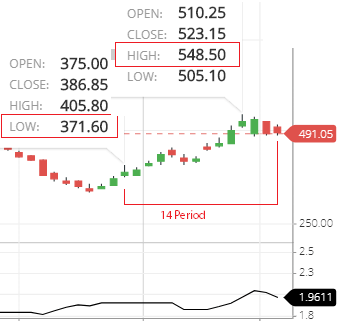
See above the chart, I use the GAPO indicator, the 14-period the highest price is 548.50 & the lowest price is 371.60.
So, GAPO or GRI = log(548.50-371.60)÷ log(14)
GRI = log(176.9)÷log(14)
GRI =2.24772 ÷1.14612
GRI = 1.9611 ( check this indicator value above the chart. chart value is also 1.9611.
How GAPO indicator works
If a specific period highest high and the lowest lows price difference is increasing then this indicator will rise up. because increasing the difference, the value will also increase. then calculated value also increases that’s why this indicator line will rise up to match with the calculated value.
What Gopalakrishnan Range Index indicator tells you
- In the 14 period if the share price doesn’t make new high or low. then the indicator value will remain the same. so there will be a flat line formed. you will not see any rising or falling in this indicator line.
- In the 14 periods if the current candle of the share makes new high or low. then this indicator value will be increase. so the indicator line will be rise.
Gopalakrishnan Range Index Trading strategy
- If this indicator line is stable, then you can find the highest & lowest Point, so in this situation you can use the highest Point as a Resistance zone & lowest Point as a support zone. For Intraday trading you can buy near the lowest point of the share price and sell near the highest point of the share price.
- For a long time frame chart if this indicator rises up, this is the signal of trending Market. Because in the long time frame chart, if 14 Periods highest high and the Lowest low difference value is high that means the market is a trend or highly volatile.
- You can use this indicator with MACD. So that when This indicator will start rising and in the MACD indicator, if the MACD line crossing the Signal line and MACD line moving upward direction this is the buying signal. If MACD line crossing Signal line and moving downward direction this is the selling signal.
*Read MACD indicator to understand properly
Limitation
GAPO indicator value will be change when market archive new high or low in the specific period. So, when the market is not breaking a specific period high or low then indicator value will be stable & market-changing of the share price will not reflect this indicator. also in the trading market, GAPO will not show the direction of trends.
Conclusion
Gopalakrishnan Range index is helpful for measure specific period price range. When indicators rising up this means the price range is increasing. This value of the indicator will minimum when the price range is low in a specific period of time.
*Read Related Post for more information.