High low bands indicator is the form Triangular moving average, the median line is the triangular Moving Averages and both side’s bands lines are created from the median price by shifting upside and downside in a specific percentage.
Median Line is the triangular Moving averages. the upper band is plotted above the median line at a specific percentage. And lower band line plotted below the Median line in a specific percentage. Both sides lines plotted in the same percentage above from the median line.
High low bands (HLB) indicator setting
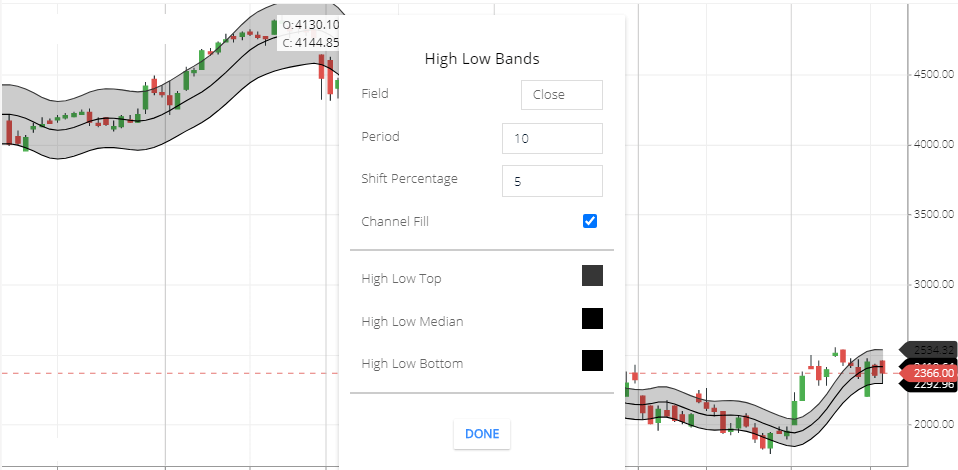
- Field: By default Field is the Closing price. this means period closing price consider as a period price movement. And the closing price will need to calculate the triangular moving average. So the Median line will Move base on the closing price. Other field options also available like , opening price, high, low, closing, etc.
- Period: by default Period is 10. This means the closing price of the previous 10-period price value will take to calculate this indicator line.
- Shift Percentage: By default value is 5. This means, upper and lower bands will be plotted 5 percentage above & below the Median line.
- Channel Fill: using channel fill bands will be filled by transparent color.
- High low Top: this means high low indicator Top Line color.
- High Low median: This means this indicator Median Line color.
- High Low Bottom: This means, this indicator Lower line color.
To understand, how High Low Bands Indicator works, take a triangular moving average line and set period 10. then you will see 10 periods moving the average line will be the same as the median line. and the upper and lower line is plotted 5% above or below from the median line. this is the high Low Bands indicator calculation also.
What HLB indicator tells you,
High low bands tell you when the market is in bullish trend then most of the time the share price will be above the Median line.
If the market is in bearish Trend then most of the time the share price will below the median line.
in the highly volatile stock, bands will be too wide. Low volatility stock bands will be narrow. In the volatile market sometimes share prices will be above the median line and sometimes it’s will Below the median line.
High Low bands indicator Trading Strategy
In the trending market if the share price is above the median line then you can buy shares. And if the share price is below the median line then you can short sell.
If the market is Volatile then you can do an Intraday or short period of time Trading. Buy near lower bands & sell near the upper band. Because in the volatile Market, indicator lower band is like a support zone & the upper band is like Resistance zone. One thing should keep in mind that if the price breaks the support zone, then share price can fall more. Similarly, if the price break the Resistance zone then share price can rise more.
Conclusion
High low bands indicator is formed of Triangular moving average. using bands will help to identify trends. Volatility, and support or resistance zone in the range-bound market.
*Read Related Post for more information.