This is an all in one indicator. Ichimoku clouds tell you trend, momentum, support, Resistance, buying, and selling Position in one view. Ichimoku is a Japanese word which means all in one. This Indicator created by Goichi Hosoda.
This indicator base on average of high & low price of specific Period. it displays 3 views of the stock price.
- It’s a projection of the future movement of the stock.
- Show the Current price activities
- And display the previous price activities.
Ichimoku clouds setting
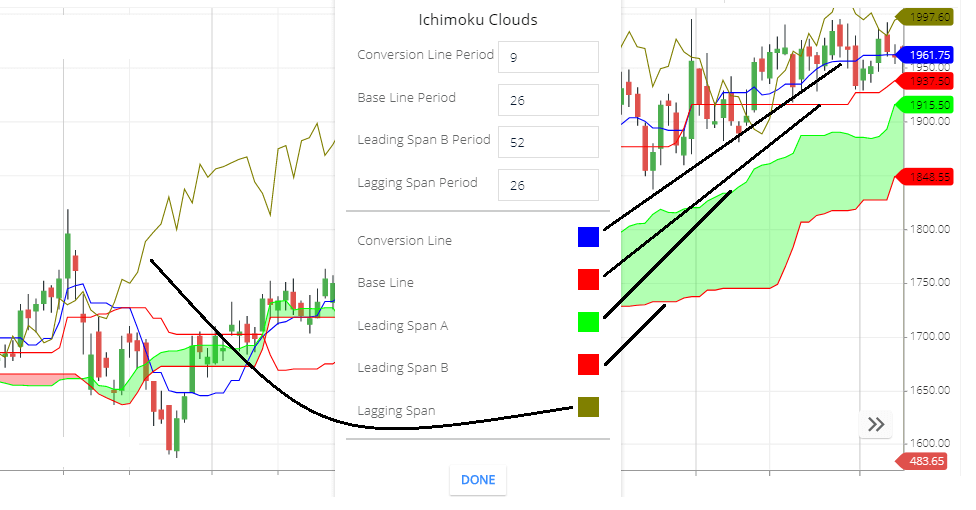
- Conversion Line Period: Conversion line period is a Averages of 9 Periods of highs and lows. And then this line will move according to the 9 period high & lowes averages. If you change 9 Period to 10 Period then the conversion line will move according to the 10 periods high and lows average.
- Base Line period: Base Line is the average of 26 period high & lows. And move according to the average value of 26 period high and lows.
- Leading Span B Period: this is the 52 Period high and lows Average. And the calculated value line will be plotted as a slower line of the cloud line.
- Lagging Span Period: by default value is 26 period. This Means closing price will plot on the previous 26 candles.
- Conversion Line: this is the color of the Conversion line. This is the fast-moving line because this is the 9 Periods Averages. Averages of the recent Period is the fast movement with stock price movement.
- Base Line: the color of the baseline. This is the slow line. Because this is an average of 26 periods. Averages of the 26 Period are the slower movement with stock price movement compared to the 9 Period movement.
- Leading span A: the color of the Fast line of the cloud line. This line created by an average of 26 periods and
ichimoku clouds calculation
Formula of Conversion and Base:
Conversion Line = (9Period high + 9 period low) ÷ 2
Base Line = (26 period high + 26 Period low) ÷ 2
[Default Conversion line color is blue & Base line color is Red.
All the Period numbers bis default numbers]
Formula of Clouds
Leading Span A Line : (Conversion line + Base line)÷2
Leading Span B Line : (52 period high + 52 period low) ÷ 2
[ All period numbers are default indicator default number]
Lagging Line: current closing price value line will plotted on previous 26 candle.
How ichimoku Clouds Works
This is all in one indicator, its display current and previous share price activities. This indicator is price base indicator.
Ichimoku gives 3 signals to show share price strength, trend, previous movement, support, Resistance, buying, and selling positions.
Conversion is a fast-moving line. The base is slow-moving Line. The crossing of both lines indicates buying or selling signals.
Clouds Color change with the crossing of Leading span A line & Leading span B line. If the leading A line is above the leading B line . Then color will be green. If B line is above A-line then the color will be Red.
Lagging Line is plotted on the previous 26 bar.
What Ichimoku Clouds tells you,
- If the Conversion line is crossing baseline & stay above the baseline. This is a positive signal.
- If the conversion line is below the baseline & stay below the baseline. This is the negative Signal.
- Clouds tell, future price movement. Red channel indicates the weak strength of the future movement & green is the stronger strength of the share price. Also if the clouds channel is below the share price this indicates a positive signal. If clouds are above the share price this indicates a negative signal.
- The lagging line tells you, if the lagging line is above the share price this is the positive signal. If the lagging line is below the share price this is the negative signal.
Ichimoku Clouds Trading Strategy
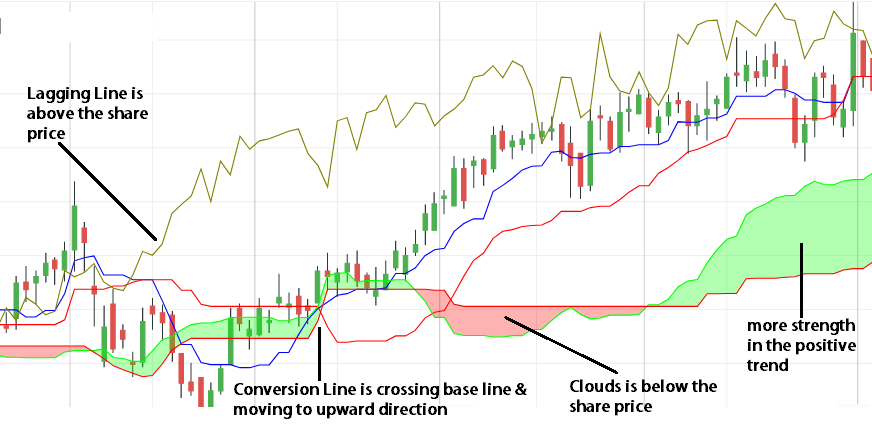
See above the chart, Blue Line is crossing Red Line, this is the first buying signal. Then see clouds channel is below the share prices, this is the second buying signal. And also the lagging line is above the share price. So this is the buying signal.
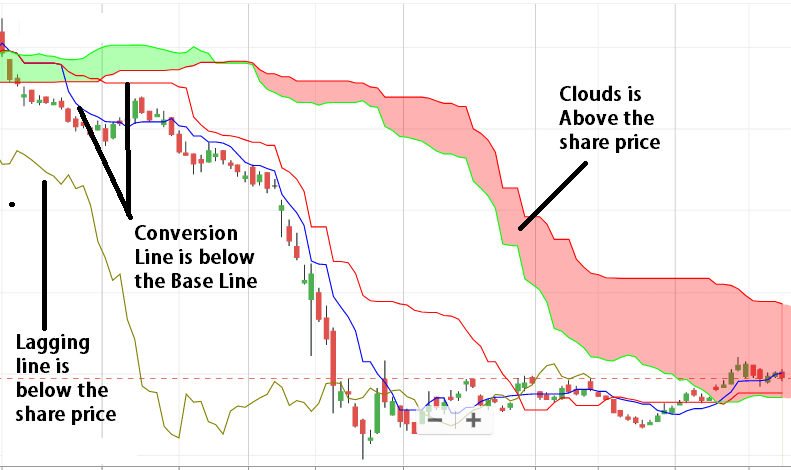
See above the chart, Redline is crossing Blue line, this is the first short-selling signal then see, clouds channel is above the share price, this is the second negative signal. And also lagging Line is below the share price. So this is the selling Position.
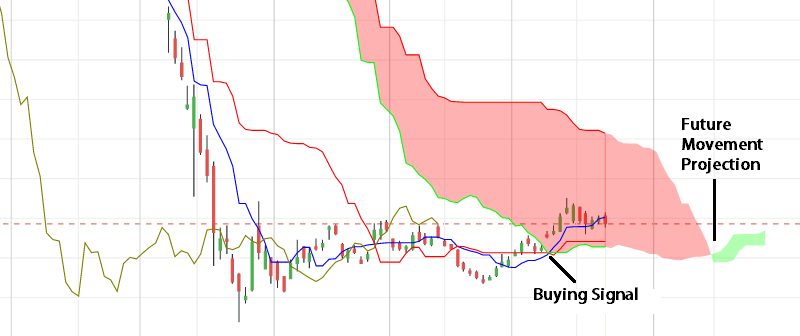
See above the chart, this is the current chart, the blue line is crossed, Red Line. And the clouds channel also green. So the first and second signals are positive. And Lagging Line is also above the share price is the buying signal.
Conclusion
Ichimoku Clouds is a versatile indicator. This is the all in one indicator of support, Resistance, momentum, trending, buying, and selling Position.
- If Blue (Conversion) Line is above the Red (Base) line this is the Bullish signal. If Red Line is above the Blue line, this is the bearish signal.
- If Clouds channel is below the share price this is the Bullish signal. If Clouds channel is above the share price this is the bearish signal. Red channel indicates the weak strength of the share price & green channel indicate stronger strength of the share price.
- If lagging Line is above the share price this is the bullish signal. If the Lagging line is below the share price this is the Bearish signal.
*Read Related Post for more information.