Intraday Momentum Index (IMI), helps us to show current stock price strength. IMI is similar to the RSI indicator its show oversold and overbought zone by measuring changes of the Candlestick open and Closing prices.
Intraday Momentum Index Setting
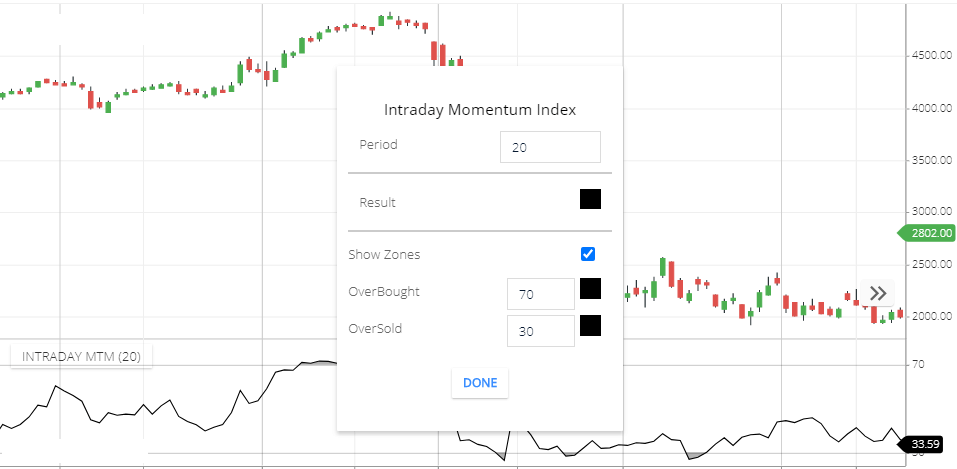
- Period: by default period is 20. This means 20 candle price activities will take to calculate this indicator.
- Result: This is an indicator line color.
- Show zones: in this indicator if indicator line is above the 70 level then this will be considered as an overbought. if indicator line is below the 30 level this indicates oversold position . this option will highlight the overbought and oversold zone.
- OverBought: this is the overbought zone level. by default its 70. but you can change it.
- OverSold: this is the overbought zone level by default its 30. but you can change it.
Intraday Momentum Index trading strategy
For intraday trading you can use this indicator , if indicator is in the oversold zone, you can buy a share. if the indicator is in the overbought zone you can sell this, these are the basic strategy of this indicator.
you can consider Overbought Zone is a Resistance Zone and Oversold Zone is a support zone. But if the share price breaks the resistance zone then share price can gain more, If the share price breaks the support zone then share price can fall more.
The advance strategy of the Intraday momentum indicator is to use this indicator with the Supertrend indicator. so that when the share price is above the super trend, then have to find buying signal in the Intraday MTM indicator. but if the share price is below the supper trend then you have to find a short-selling position in the IMI indicator.
Difference Between Intraday MTM and RSI indicator
IMI Indicator
- this indictor generally used in intraday trading.
- this indicator is fluctuating more than RSI.
- in the bullish trading market if the share price falls a little bit then the indicator will show the overbought zone. and give the opportunity to buy. similarly, in the bearish trend if the share price rises a little bit indicator will show the oversold zone and give the opportunity to sell again.
- For the long term trends, it is not useful because it will give multiple buying sell positions in the long term trend. so that will confuse for long term trading.
RSI
- RSI is used for the long term and short term trading.
- this indicator is less fluctuating than the Intraday MTM indicator.
- in the bullish trending market if the share price is falls a little bit then this indicator will not show any oversold zone. similarly, in the bearish trend if the share price is rising a little bit the indicator will not show the oversold zone.
- this indicator is more useful for long term trading. in the long term trends this will not show much false signal.
Conclusion
The intraday Momentum Index helps us to show the market trend by measuring the candlestick open and closing price. it’s this similar to the RSI indicator. but both indicator is much different from each other while showing the overbought and oversold zone.
*Read Related Post for more information.