Keltner Channel indicator is the Combination of EMA and ATR value, the combined value will be plotted as a channel. The channel tells you trend, the direction of the trend, volatility, sideways market.,
Keltner Channel indicator setting
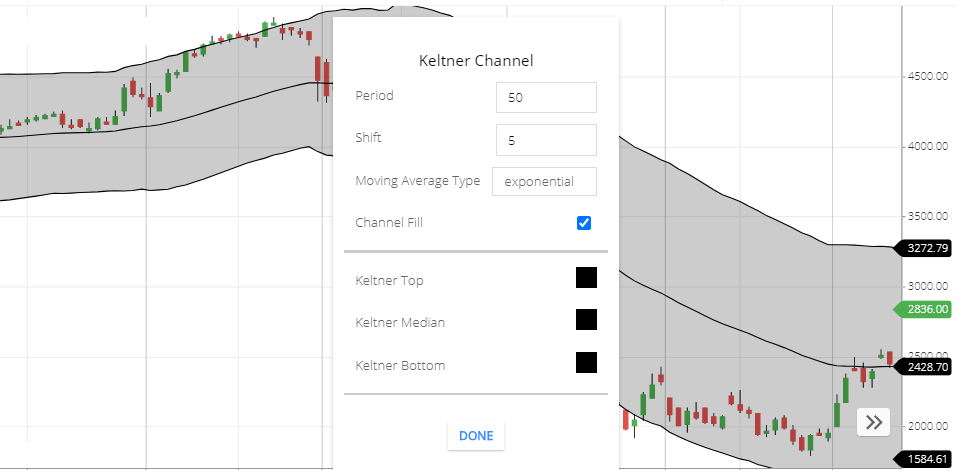
- Period: default 50-period price will take to calculate this indicator.
- Shift: shift number will take to calculate this indicator line.
- Moving Average Type: 50 Exponential Moving Averages value is taken to calculate This indicator line. The exponential moving average(EMA) is the default setting of this indicator. You can EMA to SMA or many Types of moving averages available.
- Channel Fill: if you check this, the band’s channel will fill by the black color.
- Keltner Top: this is the top line color of the bands.
- Keltner Median: Middle line color of the bands.
- Keltner Bottom: Bottom Line-color of the bands.
Keltner Channnel Folrmula
Keltner median Line: EMA value of the specific period.
Keltner Top Line: Median Line + (ATR * shift)
Keltner Bottom Line: Median Line - (ATR * shift)
Keltner Channel Calculation is
- The median line is 50 periods Exponential moving average Line.
- The top & Bottom lines are Plotted 5 times the ATR value from the median line.
ATR is a separate indicator. The full form of ATR is average true range. For better understanding, I’m giving an example of this indicator calculation. See below the chart,
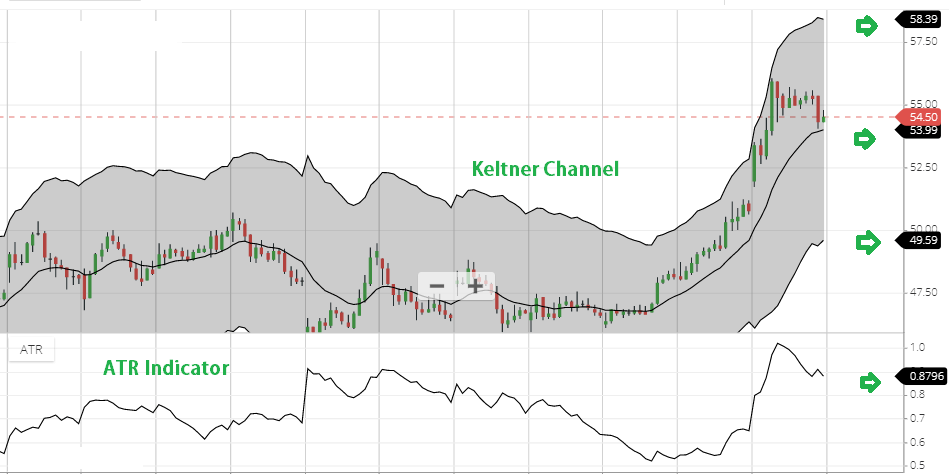
Above the chart, you can see I have used the Keltner channel & Average true range indicator. Both indicator settings are 50 Period. So here calculation is:

Median Line = 50 period Exponential moving average Line.

Top line = Median Line + (ATR × Shift)
Top line = 53.39 + (0.8796 *5)
Top Line value is 58.39

Bottom Line = Median Line - ( ATR × shift)
Bottom Line = 53.39 -(0.8796 *5)
Bottom Line value is 49.59

*All the value match with chart value
What keltner Channel indicator Tells you
- Wider bands tell you market volatility and narrow bands indicate market is sideways.
- when bands are wider this indicates the market is sideways.
- In the trending market, the channel will be slope upward or downward.
- if the share price is crossing Top Line this indicates share price rise.
- if the share price is crossing bottom Line, this indicates share price can go to downside direction.
Keltner Channel Strategy
If share price candlesticks are continuously above the median line this is the sign of a bullish trend. Or the market is in a bullish trend. And after this if the share price is crossing the bottom line. this indicates the Bullish trend may end.
If share price candlesticks are continuously below the median line this is the sign of a bearish trend. After this if the share price is crossing Topline. This indicates the bearish trend may end.
if Share prices are going above the Topline this is the signal , share price can rise. some stock price cannot go above the Topline, all the price activities are between the Top & Bottom Line. If the channel is too wide than the price movement than you can adjust the shift number is the indicator settings. A low shift number will create narrow channel, and a High shift number will create Wider channel. As your stock movement you can set this number.
So if the share price is crossing Top line then this is the signal that share price can rise. If the share price is crossing the bottom line this indicates, the share price can fall.
Limitation of Keltner Channel indicator
this indicator will not tell you support or Resistance zone. The lower line isn’t a support zone. And the upper line isn’t Resistance zone.
Conclusion
Keltner Channel indicator is base on ATR and EMA value. its how trends, trends direction, volatility, and sideways market.
* Read Related post for more information.