Linear reg forecast (LRF) full form is the Linear regression forecast indicator. this is a trend identifying and trend following indicator. the major trend is calculated by using the least square fit method.
This indicator gives a projection of tomorrow’s price. if the price is deviating from the indicator line, then the next candle price may return to the Realistic value. also, indicators can identify the trends of the market. this indicator reacts more with the price changes and less lag.
In this trading software, only one LFP line is showing. but other trading software you can see 3 lines and LRF indicator will look like a channel or bands. upper and low band is the deviation from the Middle line.
Linear Reg Forecast Setting
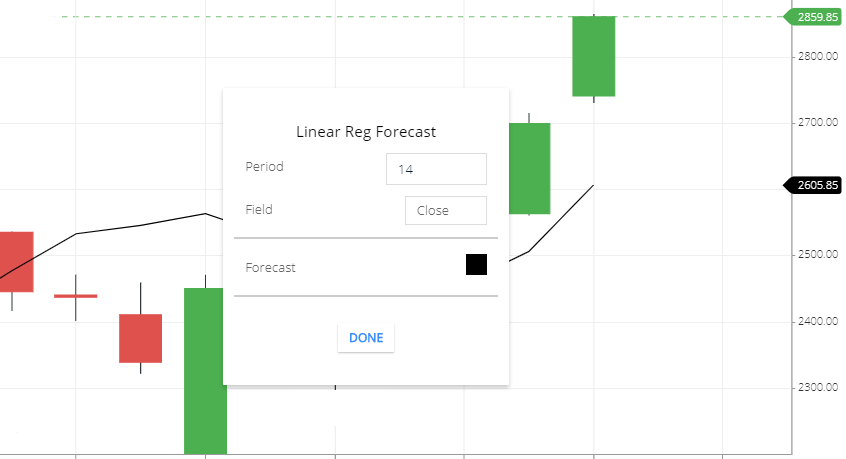
- Period: 14 Period price will take to calculate this indicator. 14 period means 14 price candlesticks.
- Field: Candlesticks’ closing price will take to calculate this indicator.
- Forecast: this the indicator line color setting.
What LRF indicator tells you
Linear Reg Forecast (LRF) indicator tells you, future price movement. if the share price is higher or lower than the indicator line you can anticipate the share price may return the realistic value.
LRF also tells you the trend of the market. LRF Line will move with the price candlesticks, any changes will reflect in the line.
In this trading software, only one line shows the trend and price movement. some trading software has three lines. one is the forecast line and the other two lines are the plotted above and below the forecast line. both lines deviate from the Middle line, and the bands show how the price deviates from the middle line. when the price is below or above the Forecast Line, the share price can come to a realistic price.
This indicator, also tells you the trend of the share price movement.
Linear Reg Forecast strategy
Strategy 1
this indicator is plotted on the share price candlesticks. if the share price is in a bullish trend, then the forecasted line will be below the share price candlesticks or most of the portion of the candlesticks will above the line.
But if the line is moving up of the share price candlesticks, this is the signal of the bullish trend that may end and bearish can be started.
Similarly, if the forecasted line is plotted above the share price candlesticks or most of the portion of the candlesticks is below the forecast line, this indicates the market is in a bearish trend.
but if the forecast line is moving below the share price candlesticks, this is the sign of a bearish signal trend that may end. a bullish trend or a sideways market can start.
Strategy 2
Use this indicator conjunction with the Alligator indicator. when alligator and LRF indicators both giving the bullish trend. then but the stock.
if the LRF indicator is a signal trend can be changed then you can check its in alligator indicator. and if both indicators confirming the trend will change. go with the trend.
Conclusion
Linear Reg Forecast (LRF) or linear regression forecast Indicator is the use to tells you the future price movement and trend of the future price.
*Read Related Post For More Information.