In a simple word, the median price is the average price of ever period and then sum of all the average period price and dividing the result by the total number of periods.
Med price indicator first calculates the average price of each candlestick then sum all the specific period average price and then divided by the specific period number.
if you check the Overlay option in this indicator setting then the indicator will line will be plotted on the share price candlesticks. then this will work like SMA Line.
Median Price indicator setting
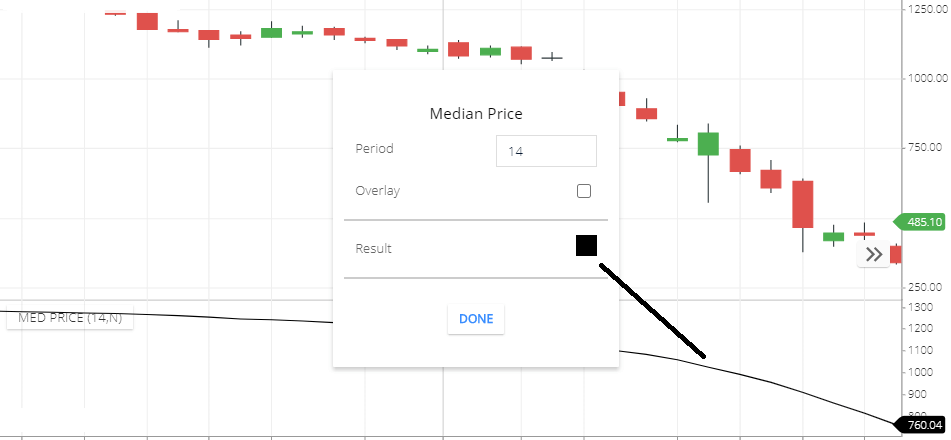
- Period: The number of period means, the calculated result will be base on the period number. here, the default number is 14. this means the 14-period average price will show in this indicator line.
- Overlay: if you check this option then indicator line will be plotted on the share price candlesticks. and give you a view of when the average price below the current share price and when the average price is above the share price.
- Result: this is the indicator line color.
Median Price indicator calculation
The formula is very simple, fist calculates specific periods each candlesticks average price then sum each candle average price and dividing the result by a specific period.
Formula:
 first calculate each candle average = (High price + low price)/2.
 then sum all 14 candle average.
 then divided the 14-period average price by 14.
This indicator tells you, a certain period’s average price. if you check the “overlay” option then the average line will be plotted on the share price candlesticks. so that it will show the historical average and price movement view.
Median Price indicator trading strategy
when the current share price above the median price indicates share price is stronger. in a stronger trend, you can go with buying position.
if the current price is below the median line this indicates weakness in the share price. so you can take a chance to sell in this situation.
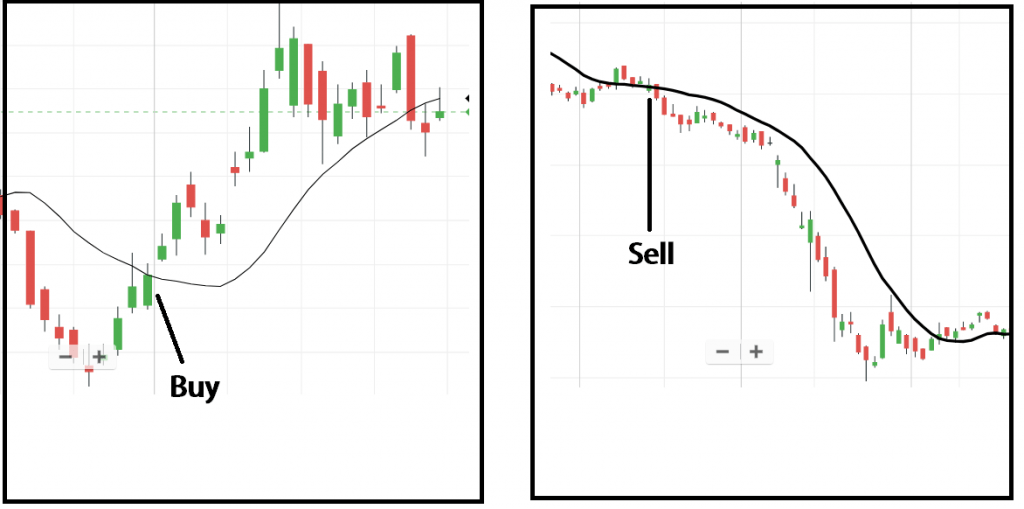
See above the chart, If you check the “overlay” option in this indicator settings then the indicator line will be plotted on the share price candlesticks, then you can see historical price movement with average price line. It will help to get future price and average price movement overview. also you can take a trade when the share price candle is going above the median line you can buy the stock. and if the share price is falling moving down and after crossing the median line you can short sell the stock.
Conclusion
The median price indicator is used to show the average price of the specific period. so that when the share price is above the average price this indicates share price stronger and if the share price is trading below the average price this indicates weakness in the share price.
*Read Related Post for more information.