Money flow index (MFI or M FLow) Oscillator is the volume-weighted RSI Indicator. This is the combination of volume and price movement and tells you, buy, and sell Position.
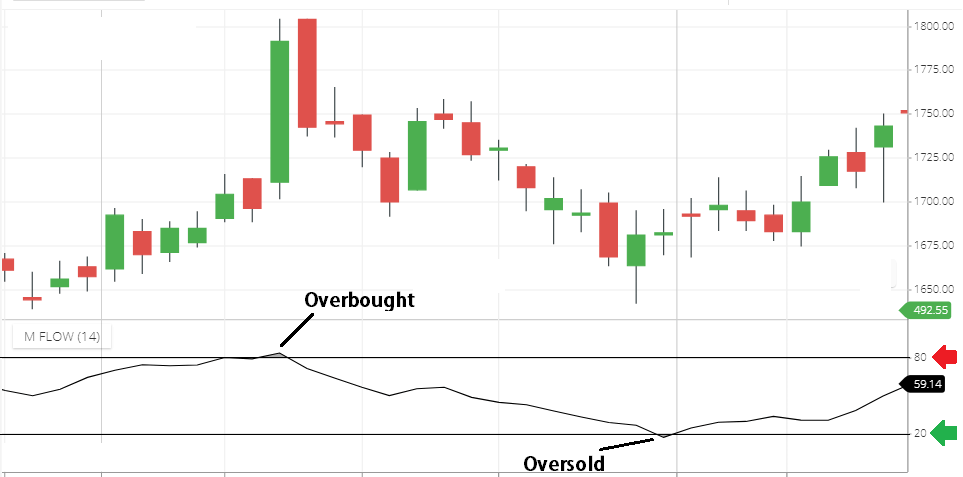
This indicator basically oscillates between 0 to 100. Above 80 is the Overbought zone, below 20 is the oversold zone.
Money Flow index Setting
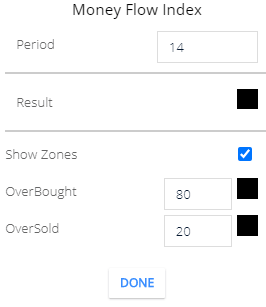
- Period: The default period is 14, this means the calculation will base on 14 candlestick price and Volume.
- Result: Indicator line color.
- Show Zones: if you check this option, when the indicator line is crossing 80 & 20 levels of this indicator, the line will be highlighted by the color.
- overbought: you can define the overbought zone level and color. when the indicator line will move above the 80. then the color will highlight the position.
- oversold: you can define the oversold zone level and color. so when the indicator line will move below the 20, the color will highlight the position.
What MFI indicator tells you
- When the Money flow index is moving below the 20 line this is Sign of Oversold zone.
- MF index is moving above the 80 line is the Overbought zone.
- 50 level is the Middle line in this indicator.
- M flow index is above 50 level is Bullish Signal & below the 50 level is a bearish signal.
Money flow index Indicator trading strategy
Strategy 1
This is the simple Strategy , when the Indicator line is below 20 level this is an oversold zone or support zone. You can buy shares with proper stop loss. But sometimes in the oversold zone share price can break support level, then share price will fall more.
After buying a share in the oversold zone. if the Indicator line is crossing 50 level this is more bullish Signal. if you wouldn’t find 50 level right side of the indicator, then draw the 50 level horizontal line in your training software. ( almost all the trading software drawing tool available, find in your trading software)
If the share price breaks support level in the Oversold zone then fall price can fall more.
when the Indicator line is above the 80 level , this is Overbought zone or Registance zone. You can Short sell here with proper stoploss. In Overbought zone If share price break Registance level. After Breakout the share price can rise more.
After selling in the Overbought zone, if share price is crossing 50 level and moving below. Below 50 level is the more bearish signal.
Strategy 2
Using the MACD indicator line with the Money Flow index.
Buying signal: When MFI is moving out from the oversold zone and crossing 50 level. This is the buying signal.
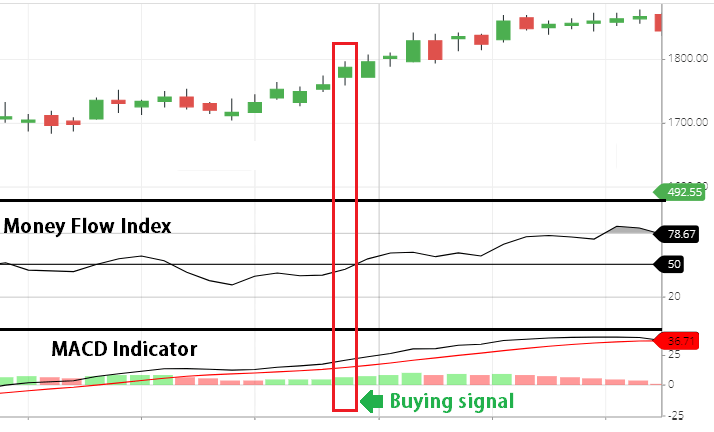
And in the MACD Indicator, the MACD line is moving crossing Signal line & moving to upward direction. And above the zero line this is the buying signal in MACD Indicator.
So, When both the Indicator line is giving a buying signal, then you can buy.
Selling signal: when in the Money flow index Oscillator is moving below 50 line. After crossing the 50 line, this is the selling signal.
And in the MACD indicator, if the signal line is crossing the MACD line, and below the zero line is the sell signal in the MACD indicator.
When both Indicators giving a sell signal, then you can short sell share.
Conclusion
Money flow index Oscillator is calculated by volume and price & tells you overbought and oversold zone. So that if the share price is in the Overbought or Oversold zone, there is a possibility price can reverse.
So that you can buy at the oversold zone and sell at Overbought zone. And above 50 level of this indicator is Bullish signal. And below 50 level is a bearish signal.
You can use MFI Indicator with other indicators also, like MACD, etc, etc.
*Read Related Post for more information.