Moving average envelope (MAE or MA Env) is the derivative of the moving average (MA) indicator. MAE is the moving average indicator with the top and bottom bands which are shifted above and below the middle line.
Moving Average Envelope Setting
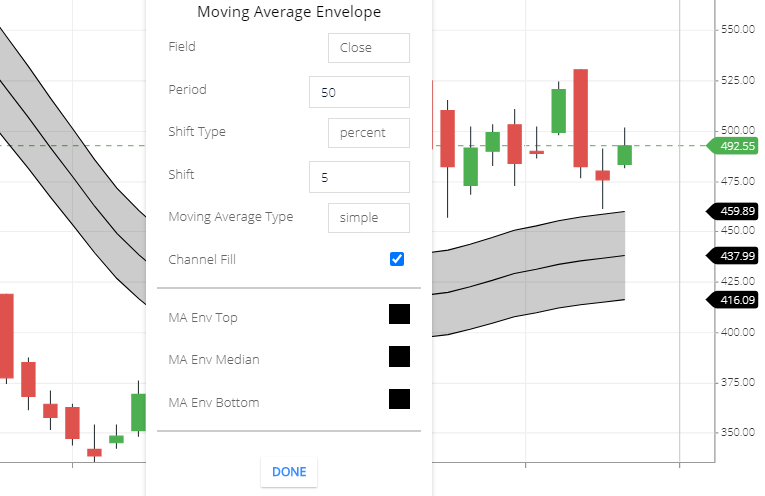
- Field: The Default field is ‘close’. that means period (candlesticks) closing price will take to calculate this indicator.
- Period: The default period is 50. this means 50 share price candlesticks closing price will take to calculate this indicator.
- Shift type: Two types of shift available, percent, and point. default shift type is a percentage, this means the bands will shift from the middle line by a specific percentage or if you select point then bands will shift from the middle line by a specific point.
- Shift: you can specify shift value. default shift value is 5. this means bands will shift 5 percent from the middle line.
- Moving average type: Default Moving average type is “Simple”. this means the calculation will be the simple moving average. other moving average types also available, like exponential, time series, triangular, time series, etc, etc.
- Channel Fill: the gap between the upper band and lower band will fill by the color.
- MA Env Top: This is the upper band (Upper line or top line or MA Env Top) color.
- MA Env Median: this the middle line ( or median line) color.
- MA Env Bottom: This the Lower Line ( Bottom line) Color.
Moving Average Envelope calculation
- So the Middle line is the 50 periods simple moving average line.
- The Top line is plotted above the middle line, by shifting 5 percentage of the moving average price.
- The bottom line is plotted below the middle line, by shifting 5 percent of the moving average price to the lower side.
MAE indicator trading strategy
Support Level
Generally Moving average used to see How current price is above or below the Averages price of some Periods. And some traders use the moving average as a support and resistance zone.
When the share price is above the moving average line then the moving line is like a support level. You can exit from the stock. If share price breaks support level.
Sometimes share price break moving average and again price reversal started. but using the Moving average envelope you can use the bottom line is an ultimate support level. If share price breaks bottom bands then you can exit from the stock.
Resistance Level
If the share price is below the moving average line, then you can use the moving average line as a resistance line. If share price break Resistance level then you can buy the stocks if you already bought the stocks you can hold.
But sometimes share price is breaking resistance level. Then the price started falling.so using MA Env, the top line is the ultimate Resistance level. So if share price breaks the ultimate resistance level. Then you can enter to the stock.
Conclusion
Moving average Envelope is the moving average line with 2 bands. You can use top and bottom bands as the ultimate support and Resistance level.
*Read Related Post for more information.