The Concept of on-balance volume (OBV or On Bal Vol) indicator is if the volume is increasing and the price is not changing then share price may jump to the upward direction or fall sharply.
OBV calculates adding the Volume in the bullish period and substrating the volume in the Bearish period.
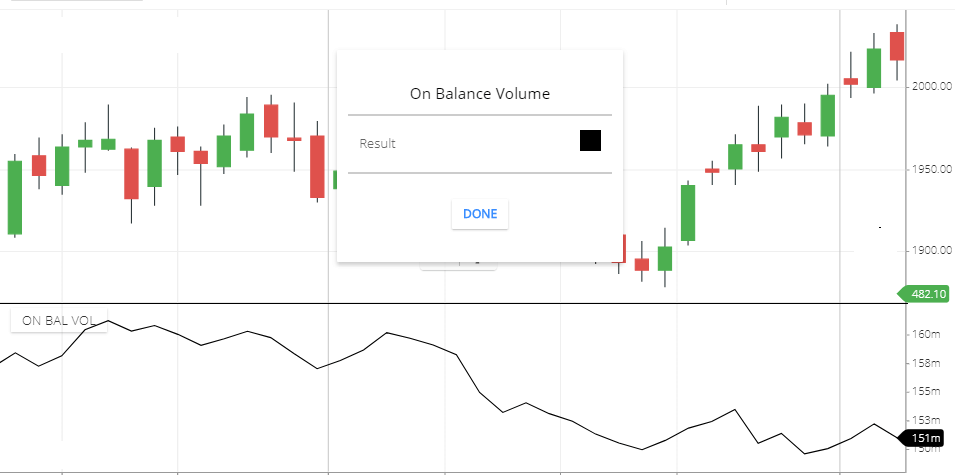
OBV indicator Setting
On Balance Volume Calculation
- If today’s closing price is higher then the previous day’s closing price then, Volume will be added to the OBV.
- If today’s closing price is lower then the previous days Closing price then, the volume will be Substrated.
In the closing price Up then the previous days then the formula is:
OBV = Previous days OBV + today Volume.
If the closing price is down than the previous days then, the formula is:
OBV = Previous Days OBV - Today's volume.
What OBV tells you
- In the high volume, if today’s closing price is higher than yesterday’s closing price, then Indicator will move more in the upward direction sharply.
- In the low volume, if today’s closing is higher than yesterday’s closing, then Indicator will move less in the upward direction compared to High Volume.
- In the High trading volume, if today’s closing is lower than yesterday’s close, then the indicator will move more in the downward direction.
- In the low volume, if today close is lower than the yesterday close, then Indicator will move less in the downward direction compared to the high volume.
On balance volume trading strategy
- When the Indicator is moving upward direction then share price can rise upward.
- When the indicator line is moving downward direction then share price can go in a downward direction.
- In the Range bound market, if the indicator line is moving upward. It can give a breakout of the share price. And the share price can rise more.
- In the Range bound market, if the indicator line is moving downward direction, then it can give a breakdown of the share price, and share price can fall more.
- Bearish divergence: if the share price is moving upward direction and Indicator is not moving upward direction or moving Downward direction, this is the signal of share price reversal. Share price can fall.
- Bullish divergence: if the share price is moving Downward direction and Indicator is not moving downward direction or moving upward direction, this is the signal of share price reversal. Share prices can rise.
Conclusion
On Balance Volume (OBV) Indicator is the measure, when the volume is increasing and the price is increasing then the volume will add to calculation. And if the price is decreasing then the volume will substrated in the calculation of this indicator.
When price and the OBV is increasing it indicates bullishness. And price and Volume decreasing it indicates bearishness. Also it’s will indicates breakout and breakdown, bullish and bearish divergence.
*Read Related Post For more information.