The full form of Parabolic SAR is parabolic stop and reverse indicator. This tells you market trend, trends changing, buying selling Position.
Parabolic stop and reverse Setting
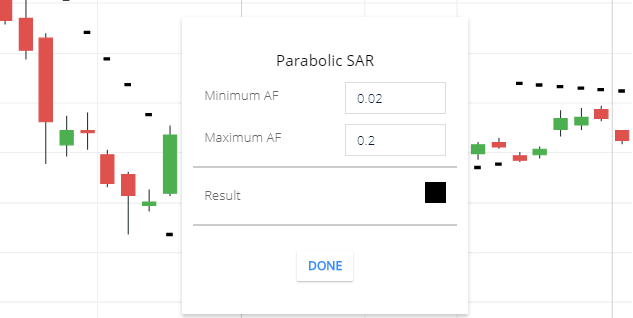
- Minimum AF: The default value is 0.02. my recommendation to use this value.
- Maximum AF: The default value is 0.2. I recommend you to use this value.
- Result: this is the parabolic stop and reverse indicator line color.
Parabolic Sar tells you,
When the share price is in Bullish trend the indicator line will be plotted below the share price candlesticks.
If the share price sharply increasing then the dotted line gap will be increased.
If the Dotted line comes closes to price candlesticks. This is the signal trend that may end. And if the Dotted line is plotted above the share price candlesticks then share price changes the direction. This is the bearish trend.
Parabolic SAR trading strategy
Strategy 1
When the Dotted line changes position upside to the downside of the share price. Then you can buy stock with proper stop-loss. If the stock is in the Trending market then you can stick to the stock. Exit when the Dotted line is plotted above the candlesticks.
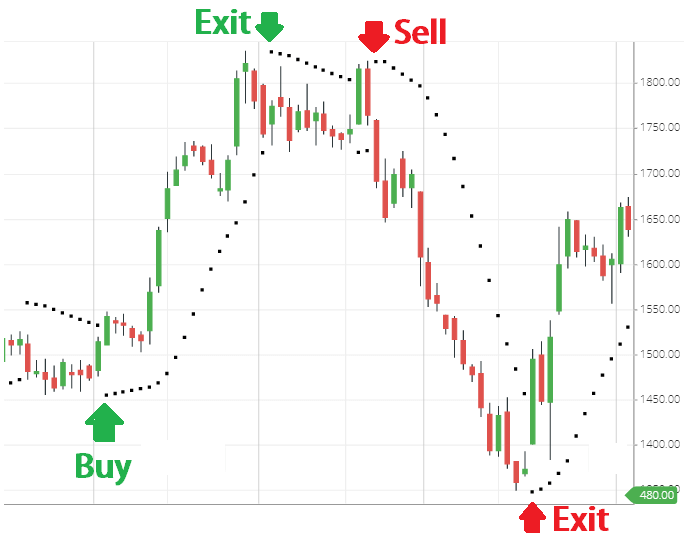
When the Dotted line is started forming above the share price candlesticks. Then you can sell the stock with proper stop-loss. And if the stock is in bullish Trend, you can stick with the trend. If the Dotted line plotted below the candlesticks then exit from the stock.
Strategy 2
Use this indicator with MACD or other Indicator. Here I’m using Parabolic stop and reverse with a combination of MACD Indicator.
If Parabolic dots started forming below the candlesticks, this is the buying signal in this indicator.
And in the MACD Indicator if the MACD line is crossing the Signal line and moving in an upward direction. Above the zero line in the MACD Indicator, this is the buying signal in MACD Indicator.
When both Indicators are giving buying Signal then you can buy the stock.
If parabolic Stop and reverse dotted line is started plotted above the share price candlesticks this is the selling signal in this indicator.
And in the MACD indicator, if the signal line is crossing MACD Line and moving below the zero line. This is the selling Signal in MACD Indicator.
If both the indicators give a selling signal, then you can sell the stock.
Strategy 3
Use this indicator with the conjunction of the RSI indicator. if the parabolic stop and reverse indicator are below the share price candlestick, this is the buying signal. and in the RSI indicator if the RSI line is above the 50 level. then you can buy the stocks. using both indicator confirmation.
Selling signal: if the Parabolic SAR indicator is above the share price candlesticks, this is a selling signal. and in the RSI indicator, if the RSI line is below the 50 line, this is the selling signal. so when both the indicator indicating to sell, then you can sell the share.
Conclusion
Parabolic SAR is the trend following indicator, which helps to find the trend, ending of the trend, buying, and selling position.
The main function of this indicator is its shows dot about or below the candlesticks and it looks like a dotted line. when the share price is in bullish trend then the dots will plot below the candlesticks.
When the share price is in bearish trend then dots will be plotted above the share price candle. also, You can use this indicator combination with other Indicators also for better Trading signals.
*Read Related Post for More information.