In a simple word, the Psychological line (PSY) indicator helps you when the buyer’s taking control of share or seller taking control of the share price.
50 percentage value is the balance of this Indicator. Above 50% is buyers control the share price and below 50 % is the seller control the share price.
The indicator is measured by the rising period number and total time periods will take to measure this indicator.
The indicator is the ratio of the rising Period and total number of period.
Psychological Line Setting
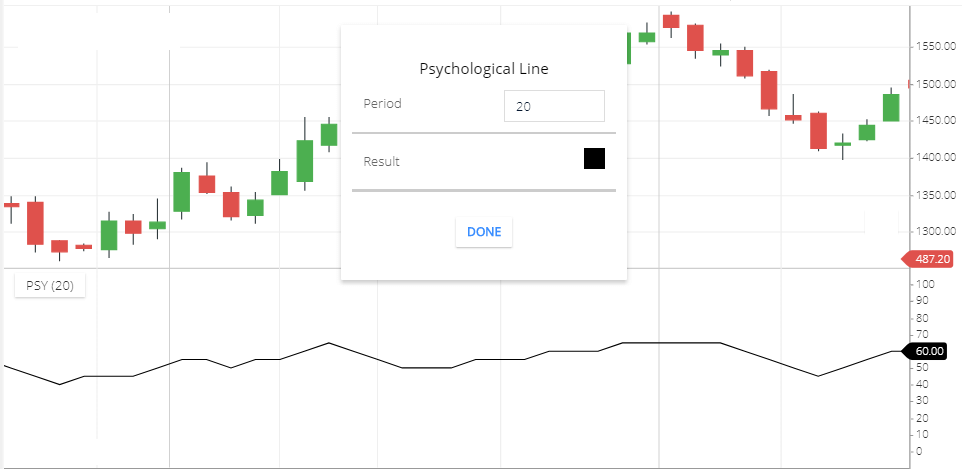
- Period: the default period is 20. This means a 29-period rising period will take to calculate this indicator. Then the total number of the rising periods will be divided by 20 periods.
- Result: This is the calculated line of this Indicator. Means Indicator line. And you can change the Indicator line color.
Calculation
Psychological Line indicator formula is, it takes all rising period of the specific period the divided the rising period number by a specific number of period. Then the result will be multiplied by 100, to get a percentage of the value.
Formula = (rising Period number within a specific period/ specific period) × 100.
What PSY Indicator tells you
PSY indicates when the buyers are controlling the share price. And when the sellers are controlling the share prices.
Above the 50 level of this Indicator is the bullish side. Means’ share prices are controlled by the buyers.
Below the 50 level of this Indicator is a bearish side, and share price is controlled by the sellers.
If the PSY is moving near the 50 line. also up and Down around the 50 line. Means sometimes the Indicator line above the zero then below zero. This is the balance of the buyers and sellers.
Psychological Line Trading strategy
Strategy 1
- If the Indicator line is moving upward direction, after crossing the 50 line. If the indicator continues moving up. You can take a buy Position.
- If the indicator line is moving Downward direction, after crossing the 50 line. If the indicator continues moving down. Take a short sell position.
Strategy 2
- You can use the Psychological line Indicator with a combination of RSI. If PSY is moving above 50 line is a buying signal. And in the RSI Indicator is RSI line is also above the 50 level. Then you can take a buying position.
- If PSY is below the 50 line. And RSI is also Below the 50 level. Then take a short sell position.
Strategy 3
- use this Indicator with MACD Indicator. If PSY is above 50 level. And. In the MACD Indicator, if the MACD line is crossing Signal line and moving upward direction. After crossing the zero line. Take a buy Position.
- If PSY is Below the 50 level and in the MACD Indicator if the Signal line is crossing the MACD line. And moving Down below the 0 line. Below the zero line, is the short-selling signal.
Conclusion
Psychological Line (PSY) Indicate when the buyer is controlling the share price movement and when the seller is controlling the share price Movement.
*Read Related Posts for more information.