in a simple word, the Qstick indicator gives you buying and selling signal, it has an indicator line that oscillates above and below the ‘zero’ line. and show you overbought and oversold zone, so that you can take your positions in the stock market.
QStick indicator is developed by Tushar chande, Tushar chande has developed lots of technical indicators in the stock market. this indicator is similar, like RSI, intraday momentum and etc indicators.
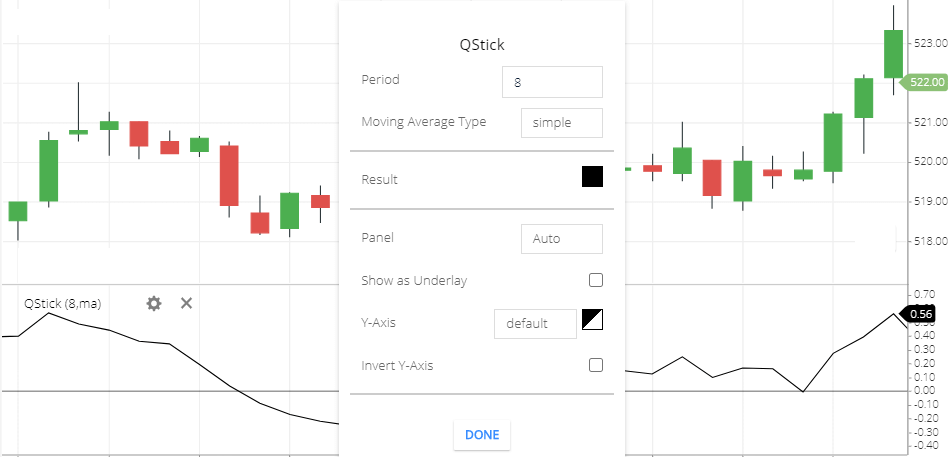
Qstick indicator Setting
To use QStick , search in your trading software “Qstick”.
Below all the option is setting of this indicator.
- Period: 8 period means 8 candlesticks of the share price. this 8 period is the default value in this indicator. and the 8 candlestick price will take to calculate this indicator and the indicator line will oscillate base on the 8-period price.
- Moving average type: Moving average type means the average price of the 8 periods. different types of moving average available. so by default its set as a simple moving average. there are many types of moving average available. you can read this moving average post for more information.
- Result: This is the Indicator line which will oscillate, and you can change the color of the line. The default color is black.
- Panel: this is not much important. this is just an indicator panel setting.
- Y-axis: you can change the location of the right side values of this indicator. in some of the trading software, this option may not available. but this is not much important option.
- Invert Y-axis: the right-side value of the indicator can invert if you check this option.
Qstick Indicator trading strategy
- If the indicator line is moving down and after falling below the ‘zero’ line, this indicator signaling a selling signal. ( again I’m repeating this if the indicator is moving downward direction then after crossing the ‘zero’ level, the indicator is giving a selling signal). this is generally for a short-selling signal.
- If the indicator line is moving upward direction, after crossing up the ‘zero’ line. this indicates the buying signal.
- when the indicator line falling down too much, this can be an oversold zone. and share reversal possibility in this situation. and share price can rise, so you can take a buy position.
- when the indicator line was rises too much, this can be an oversold zone. after the oversold zone, the stock price may fall. so if the share price reversal is started then take a short sell position.
- Sometimes share price touching higher high and this indicator line is not touching u higher high, this is the bearish divergence. the share price may fall soon.
- Sometimes share price is hitting lower low and the indicator is not touching the lower low point. this is called bullish divergence. the share price may rise soon.
limitations
Sometimes the stock price is crossing up the ‘zero’ line. and after buying the share its suddenly touching the zero line. and sometimes the stock price is crossing down the ‘zero’ line then after selling the share then the indicator is started rising and crossing up the ‘zero’ line. so in this situation .this creates lots of falls signals.
Divergence also not properly identified. sometimes you can buy or sell shares to see the bullish and bearish divergence then the indicator later you found the that was not a divergence. that was some noise. and this will always confused to trade.
Conclusion
Qstick Indicator looks like an RSI indicator, it has a middle line (0 line). the indicator line will move around the ‘0’ line. above the 0 line is the positive side and below the ‘0’ line is the negative side. also, it shows divergence that you help you to trade using the Qstick indicator.
*Read Related Post For More Information.