Rainbow moving average (RMA or Rainbow MA) indicator is the bunch of 10 Simple Moving average (SMA) lines, each SMA line is formed by the previous SMA value.
It will show you, multiple SMA Line in a different color and help you to trade above and below the lines.
Rainbow moving average setting
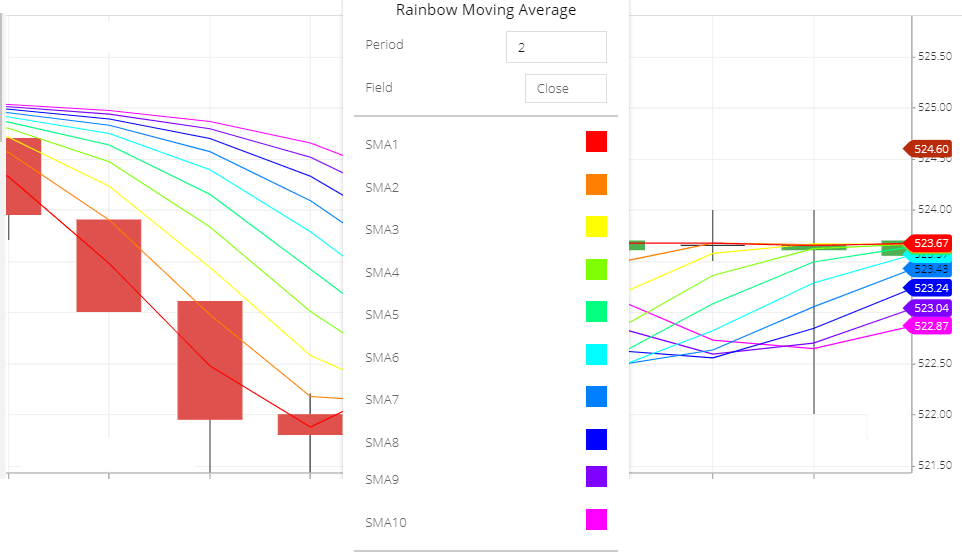
- Period: The default period is two. each line is the previous lines 2-period simple moving average line.
- Field: the default field value is ‘close’ this means the simple moving average line will be calculated by the closing price of the period. other field options also available like a period high price, low price of the period, opening price, etc.
- SMA1,2,3,4,5,6,7,8,9,10 all the SMA line color setting. you can change the color if you want.
How Rainbow MA Line formed
- THE First SMA1 line is the last 2-period share price’s simple moving average line.
- and then the SMA2 Line will be formed by the last 2 periods SMA1’s Simple moving average.
- The then SMA3 will be formed by the last 2 period SMA2’s simple moving average.
- and respectively all the 10 Lines will be formed by each other previous SMA value.
What RMA indicator tells you
- this will tells you the trend of the share price when the stock price is above the rainbow lines. this signaling a bullish trend.
- and when the share price is below the rainbow lines this signaling a bearish trend.
- so that according to the trend you can take your position.
Rainbow Moving average trading strategy
Strategy 1:
- When the share price candlestick is giving closing above the all SMA line which indicating the bullishness in the share price. share price can rise, you can take a buying position.
- When the closing price of the share is below all the SMA lines, indicating the bearishness in the share price. in this situation, the share prices can fall. take a short-selling position.
Strategy 2:
- If the closing price is above all lines then you can wait for the next candlestick. if the next candlestick breaks the current candlestick high price then you buy the stock.
- if the closing price is below all 10 lines then you can wait for the next share price candlesticks. if the next share price candlestick is making new low compared to the previous low then you can take a short-selling position.
Conclusion
Rainbow Moving average indicator is the bunch of multiple simple moving average line. fist line is the last 2 period share price moving average and then all the line formed by the period line’s simple moving average.
It helps the traders as identifying the bullish and bearish trend and buying selling positions.