RAVI (Range Action Verification Index) indicator is the combination of the two Vidya moving average indicators (VMA). One is 7 period moving average and another is the 65-period moving average. (means one is a short time period VMA and 2nd is a long time period VMA.)
The difference between the two VMA value will show as a RAVI indicator histogram bar. the more gap between the two VMA’s value creates more high histogram bars.
- If the short VMA value is higher than the long VMA value then the histogram bar will be formed above the ‘0’ line.
- and if the short VMA time period value is less than the long VMA value then the histogram bar will be formed below the ‘0’ line.
- If the value of the two VMA values is increasing then the histogram bar height will be increased.
RAVI indicator Setting
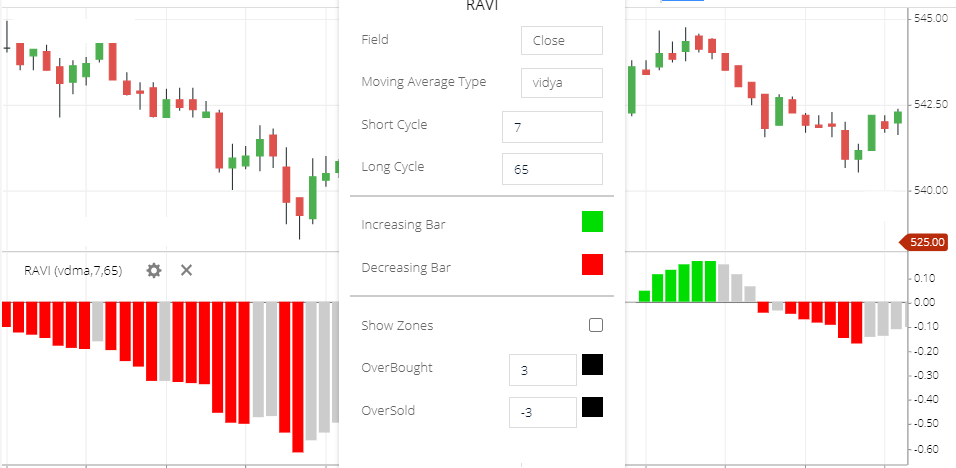
- Field: Field means the price will take those Fields. The default field is ‘close’ this means period or candlesticks closing price will take to Calculate this Indicator. Other fields are also available like open price, closing price, or high or low price.
- Moving Average type: this means Averages share price of the specific Periods. Many types of MA types available.this Indicator using Vidya moving average type. other types also available, like simple, exponential, etc.
- Short Cycle: this is the short time periods Vidya moving average (VMA). default short time period of VMA is 7 period. this means 7-period VMA price will show where to buy or where to sell.
- Long cycle: this is the long time period VMA. default long time period is 26. this means 26-period VMA price will take to calculate this indicator.
- Increasing Bar: This is the color of the histogram increasing bars.
- Decreasing Bar: Color of the histogram decreasing bar. you can change the color if you want. but the color is only for good visibility.
- Show Zones: using this option when the histogram bar is formed above or below the +3 and -3 level of this indicator then the histogram bar will show the increasing or decreasing bar color. below the +3 and -3 level, it will show black color histogram bars. +3 and -3 is the default value of the overbought and oversold zone level of this indicator. so if the share price is in the oversold zone then histogram shows RED bar. and if the share price is in the overbought zone then the histogram bars will show green bars. otherwise, histogram bars will be in the black color.
- OverBought: this is the overbought zone value of this indicator, the default overbought zone value is +3.
- OverSold: this is the value of the oversold zone. the default of the oversold zone is -3.
Range Action Verification Index Calculation
To understand it better, you can take two Vidya moving average indicator lines(one is 7 period and another is 65 period) with the RAVI indicator.
so you can see the difference,
- If the short period line is crossing the long-period line, then the histogram bars will be started forming above the ‘0’ line. and the increasing gap of the two-line show in the histogram bar. if the gap is too much then the histogram bar will be too long.
- If the short period line is crossing down the long-period line. then the histogram bars will start forming below the ‘0’ line. and if the two-line gap is increasing then the histogram bar height will also increase in the negative side.
RAVI Indicator trading strategy
- If the histogram bar started forming above the ‘zero’ line which indicates a bullish signal. you can take a buying position.
- if the histogram bar is started forming below the ‘0’ line which indicates a bearish signal, you can take a short-selling position.
- When the Histogram bars height is too much above or below the zero line. this means extreme bullish or bearish conditions. price reversal may be seen. if price reversal started you can take entry.
Conclusion
RAVI (Range Action Verification Index) indicator will display a histogram bar by comparing the two Moving average values. and tells you buying and selling signals, the bullishness of the stock price.
*Read Related Post For More Information.