The concept of the Relative vigor index (RVI) indicator is, in the uptrend the share price will close above the open price. and in the downtrend, the closing price of the share will be below the opening price.
Example: after opening the market, this is the open price of the share on that day. so that if the share price is in an uptrend on that day so the share price will rise and closing will be higher than where the share price was open. that why in bullish trend the stick price closing price will be higher than the opting price.
Similarly, in the downtrend after open the market, if the stock is falling then the closing price will automatically lower than the opening price.
Relative Vigor Index Setting
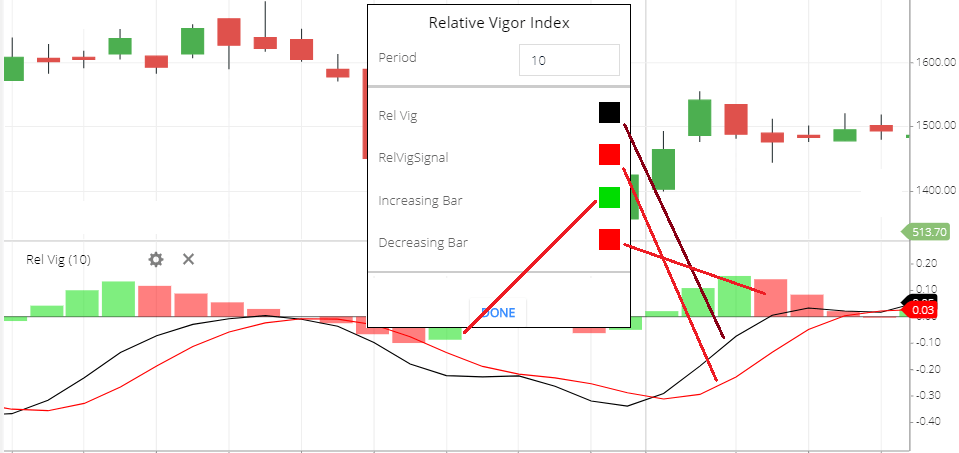
- Period: this indicator default period is 10. this means to the 10-period stock price is take to calculate the Relative vigor index indicator.
- Rel Vlg: this is the Relative vigor index line of this indicator. and the default color of this line is black.
- Relvigsignal. this is the relative vigor signal line. and the default color of this signal line is Red.
- Increasing Bar: this is the histogram increasing bar color of this indicator. by default the color is green.
- Decreasing Bar: this is the histogram decreasing bar color of this indicator, by default color is Red.
What RVI indicator tells you
- The two-line available in the Relative vigor index, when the rel vig line is crossing the rel vig signal line and moving to the upward direction, this is the bullish indication of the Relative vigor index.
- when the rel vig line is crossing the signal line then moving to the downward direction, this is the bearish indication.
- The Histogram Bar: above the ‘zero’ line is the bullish side and below the ‘zero’ line is bearish side.
Related Vigor Index Trading Strategy
- If the RVI line is above the signal line and after crossing above the ‘0’ line. you can buy the stock.
- if the RVI line is below the signal line and below the’0′ line, you can short sell the stock.
- Bearish Divergence: if the stock price touching higher high and the RVI & signal line both are not touching higher high. which is the bearish divergence. stock price reversal may soon. this is the short sell call.
- bullish divergence: if the stock price is touching lower and the indicator is not touching lower low . this is the bullish divergence. share price reversal may soon. this is the buy call.
- if the Indicator line is falling too much then there is a possibility of the price reversal. the share price may rise.
- after rising the share price there is s possibility of the share price reversal. the share price may fall.
Conclusion
Relative Vigor Index (RVI) indicator concept is in the rising market the closing price will be higher than the opening price. and in the falling market, the closing price will be lower than the opening price. Using the RVI indicator you can buy sell and the trend of the share.
*Read Related Post For More Information.