The relative volatility (RVI) indicator is calculated by the standard deviation price changes over the specific period.
this is similar to the RSI indicator, this will show you overbought and oversold zone. but the only difference is price changes of the standard deviation over the specific period rather than the absolute price changes.
Relative volatility indicator setting
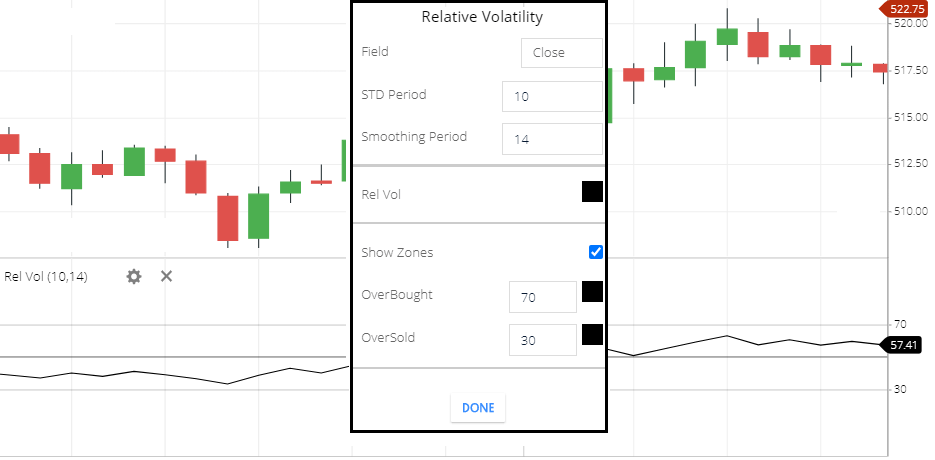
- Field: the default field is ‘close’. this means the period closing price will take to calculate this indicator.
- STD Period: STD means a standard deviation period. to calculation, this indicator 10-period standard deviation ‘will take.
- Smoothing Period: the smoothing period default value is 14.
- Rel Vol: Rel Vol means Relative volume. this is the indicator line color setting.
- Show Zones: if you enable this option then if the indicator is moving above 70 and moving below 20 then above 70 and below zones will be highlighted by the color.
- Overbought: This is the overbought zone, that you can set . by default its set as a 70. this means if this indicator is rising above the 70 level, this is the overbought zone.
- Oversold: this is the oversold zone, by default its set as a 30. this means if the Relative Volatility Indicator is falling below the 30 level, this is the oversold zone.
Calculation
The calculation is dividing the positive day’s average sum of the standard deviations by the sum of the positive and negative days average sum of the standard deviations. then multiply the result by 100.
Formula=[PSTD/{PSTD+NSTD }]*100.
Where PSTD= sum of the average standard deviation of the positive period.
NSTD= Sum of the average standard deviation of the negative period.
what Relative Volatility Indicator tells you,
- Relative Volatility Indicator line will move 0 to 100.
- if the line is moving below 30 which indicates an oversold zone.
- if the line is moving above the 70 level, this indicates the overbought zone.
- you can set perfect oversold and overbought zone, depending on the stock volatility.
Relative Volatility indicator trading strategy
- If the indicator line is moving above the 50 level, this is the sign of the bullish signal. share price can rise more. you can take a buy call.
- if the indicator is moving below the 50 level, this is the indication of the bearish signal. share price can fall more, so you can take a sell call.
- if the indicator is moving below the 30, this means share price is in an oversold zone. and price reversal may soon. but sometime in the oversold zone stock price can give a breakdown of the price, then share price can fall more.
- If the indicator is moving above the 70, this indicates the stock price is in an overbought zone. and the stock price is fall soon. but sometime in the oversold zone stock price can give price breakout, if the stock gives price breakout then the share price will rise more.
- Bearish divergence: if the share price is rising and touching higher high, and the indicator is not touching higher high, this is the bearish divergence. share price may fall soon.
- Bullish Divergence: when the stock price is in a bearish trend and touching lower low, and the indicator is not touching lower low, this is the bullish divergence and the stock price reversal may soon.
Conclusion
Relative Volatility Indicator is similar to the RSI Indicator. and the difference is already discussed. this also gives you oversold and overbought zone and buying selling positions.
*Read Related Post For More Information.