The RSI (relative strength index) indicator is one of the popular indicators used to find the oversold and overbought zone. Its bounce between 0 to 100.
If this indicator below 30 it means shares in oversold zone.
if this indicator above 70 it means the share is in the overbought zone. But the relative strength index is a useful indicator or not?
RSI indicator Setting
Go to the Indicator section and search for ‘RSI’.
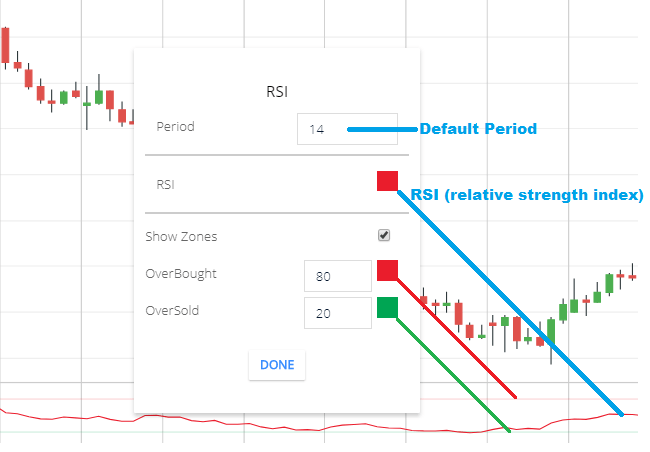
- Period: 14 periods will take to calculate this indicator.
- RSI: this is the relative strength index indicator line color settings
- Show Zones: when the indicator line goes below the overbought and oversold zone. It will highlight the oversold and overbought zone.
- OverBought: the default value of the overbought value is 20. if the indicator line goes below the 20 levels in the RSI indicator then it will measure as an overbought zone.
- Oversold: by the default value of the oversold value is 80. if the indicator line goes above the 80 levels in the RSI indicator then it will measure as an oversold zone.
Why traders use RSI?
Because this indicator interface is easy to use. If the relative strength index indicator below 30 that means to share in the oversold zone. And if RSI above 70 that means to share in over brought zone. And this simplicity attracts people to use the relative strength index.
Relative strength index indicator Limitation
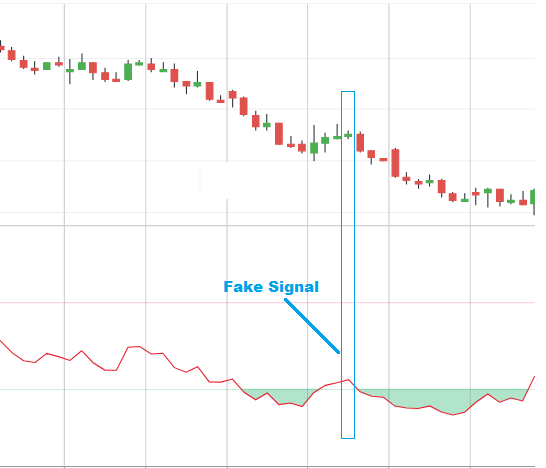
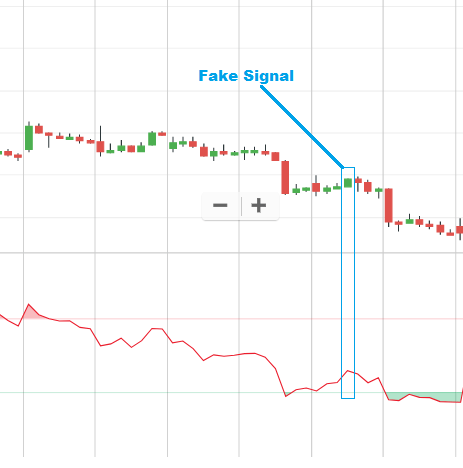
The common problem with this indicator is using alone this indicator will give lots of false signals. as usual most of the technical indicator gives lots of false signals, here I’m sharing some false signal indication.
RSI indicator trading strategy.
You can use relative strength index below these conditions.
- You can use this for range-bound trading. That means if share price trading at a range. See below the picture of the range-bound chart. In range-bound trading, If share price in oversold zone and trying to bounce back then you can enter to stock. Similarly if share price in the overbought zone you can sell.
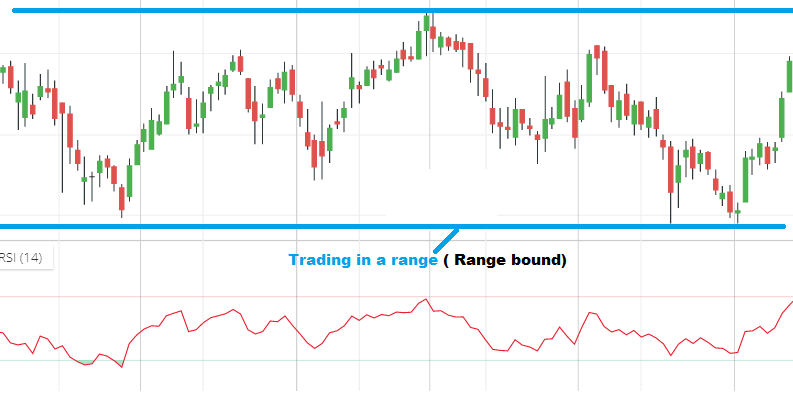
- But using a relative strength index you have to use a stop loss. Because you never know. Sometimes stock breaks range-bound trading. After breaking range-bound trading share price can fall more and more. Similarly after breaking range-bound trading in the upper side share price can gain more and more. In these cases, stop-loss saves you from huge losses.
- above the 50 zones is the bullish zone and below the 50 zones is the bearish zone. you can use this combined with other indicators. so when the other indicator is giving a positive signal and the relative strength index line is above the 50 level then you can take a buy call.
- and if other indicator is giving a negative signal, then you can confirm the in the relative strength index indicator if the RSI line is below the 50 level, then you can take a short sell call.
Conclusion
RSI is one of the most uses indicators, this indicator is a very good indicator in the combination with other indicators. This indicator is part of technical analysis, so everyone trying to find the oversold and overbought zone. my recommendation is always to use stop loss while trading with relative strength index.
*Read the related posts for more information.