The Schaff trend cycle (STC) indicator is used to tell you the overbought and oversold position so that you can buy or sell the stock at the perfect time.
The STC line will oscillate between 0 to 100. if the line oscillates above the 75 level. this is the overbought zone. if the oscillator is moving below the 25 level, this is the oversold zone.
STC indicator setting
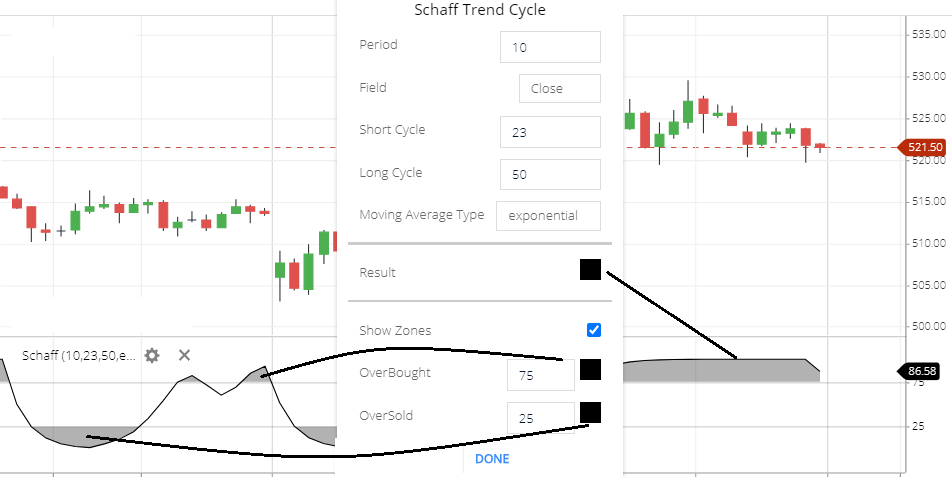
- Period: the default field period is 10. this means 10 periods (candlestick) share price will take to calculate this indicator.
- Field: the default Field is ‘close’. this means the period closing period will take to calculate this indicator. and the different types of `fields available like close, open, high, low, or any other fields.
- Short Cycle: a short length of the period that will need for calculation.
- Long Cycle: this is the Long length period, which will take for calculation.
- Moving average type: many types of moving averages available, like, exponential, simple, time series, and triangular, or etc types. here the default moving average type use in this indicator is Exponential moving average.
- Result: This is the Indicator line color.
- Show Zones: using this show zones, means when the stock price will go above the overbought zone or stock price will fall below the oversold zone. then this will show a highlighted color to show your indicator is in oversold or in the overbought zone.
- Overbought: this is the overbought zone level. by default, it set 75 as an overbought zone. so that when the stock price will rises above the 75 this is an overbought zone.
- Oversold: this is the oversold zone level. by default oversold zone set as a 25, this means when the stock price will falling below 25 this is an oversold zone.
Schaff Trend Cycle Trading strategy
- When the STC line oscillates above the overbought zone. this indicates the stock price is in an overbought zone. and the possibility of share price may fall. so if the indicator starts moving down then you can sell the stock.
- When the STC Indicator Line oscillates below the Oversold zone. This indicates the stock price is in an oversold zone and there is a possibility of stock price rising. If the indicator starts moving up then you can take a buying Position.
- Bullish divergence: If the stock price is touching lower low and the Schaff trend cycle indicator line is not touching the lower low, this is the bullish divergence, this indicates price may rise. you can wait for price reversal. if price reversal starts then buy the stock.
- Bearish divergence: If the market is in an uptrend and the stock price is touching higher high and the indicator is not touching higher high, the is the bearish divergence. this is the indication of share price reversal. the stock price may fall. if the stock starts falling then a short sell position good for you.
- Sometimes if the indicator is in an overbought zone that doesn’t mean that share price will fall. in the overbought zone, the share price can give breakout and rise more. also in the oversold zone share price can fall more.
Conclusion
The Schaff trend cycle (STC) indicator helps you to find trends and the oversold and overbought zone of the securities.
*Read Related Post For More Information.