In a simple word, the Stochastic Momentum Index (SMI) indicator tells you to overbought and oversold zone with the market directions.
It has two lines that will oscillate and tells you when the share price is in the oversold and overbought zone.
Stochastic Momentum Index Setting
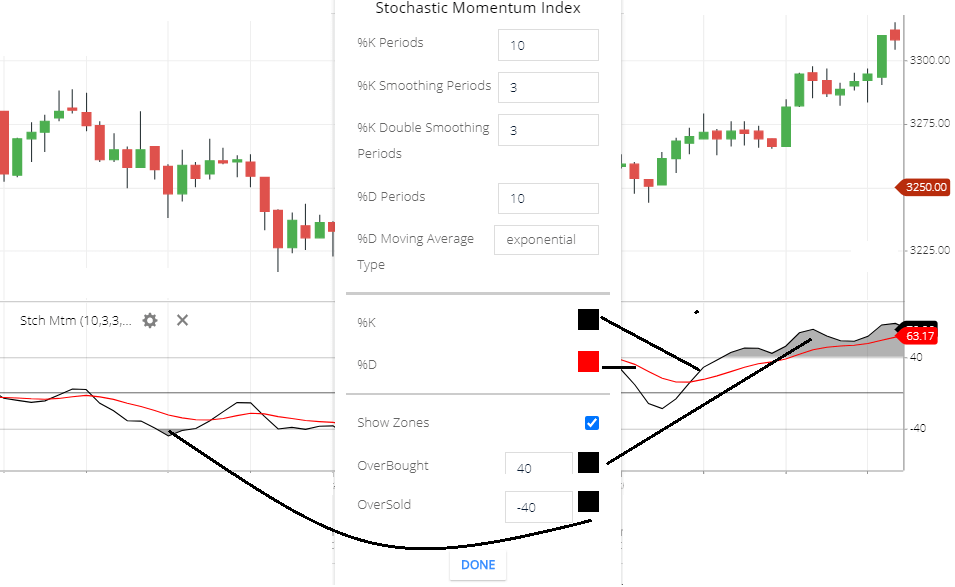
- %K Periods: The default 10-period price will take to calculate the Stochastic Momentum Index indicator.
- %K smoothing Periods: the %K line will be smooth by the default 3 smoothing periods.
- %K Double Smoothing Periods: this is the 3 periods double smoothing period of the %k line.
- %D Period: to calculate the %D line the 10-period price will take.
- %D Moving Average Type: Moving average type of the %D line is ‘exponential’. other types of moving average types also available like ‘simple’ ‘time-series’ ‘Triangular’ etc etc . simple means simple moving average, and exponential means the exponential moving average.
- %K: This is the %K line color. by default it’s black.
- %D: This is the %D line color. by default its Red.
- Show Zones: when the indicator line will above 40 and below the -40, then this will highlight those portion as an overbought and oversold zone.
- Overbought: When the indicator line is above the 40, this indicates an overbought zone. the 40 is the default value in the Stochastic Momentum Index indicator as an overbought zone.
- Oversold: If the indicator line is below -40, this indicates as an oversold zone. -40 is the default value in SMI Indicator as an oversold zone.
SMI indicator tells you
- The SMI Indicator has two lines. one is the %K line and another is the %D line.
- Stochastic Momentum Index indicator %K and the %D both the line will tell you, the overbought and oversold zones.
- the indicator line moving above the 40 level is the overbought zone.
- and below -40 level is the oversold zone.
- above the ‘0’ line is the bullish side or positive side.
- below the ‘zero’ line is bearish side or negative side.
Stochastic Momentum Index Trading Strategy
- Bullish Direction: if the Black Line (%K line) is above the Red Line. this indicates the bullish direction of the trend.
- Bearish Direction: if the Red line (%D Line) is above the Black line, this indicates the bearish direction of the trend.
- Buy signal: after finding the direction of the trend. in the bullish direction if both the lines are crossing above the ‘0’ line. then you can take a buy signal. EXIT: in the overbought zone, you can exit from the stock and take profit.
- Sell SIgnal: in the bearish trend, if both lines (%K & %D) is crossing below the ‘0’ line. this is the short-selling signal. you can short sell here. EXIT: in the oversold zone, you can exit from the stock.
- there is a possibility of the share price rising in the oversold zone. in the oversold zone if the indicator lines start to moving upside. you can take a chance as a buyer.
- similarly, share price reversal may be seen in the overbought zone. in the overbought zone, if the indicator lines start to moving downside then you can take a chance as a seller.
Conclusion
Stochastic Momentum Index (SMI) can more help you in the range-bound market, you can use this indicator in the trending market also. It will tell you the direction of the price movement and the buying selling positions.
*Read Related Post for more information.