Supertrend is the trend following indicator. It’s used to tell you the trend of the share price.
- Supertrend line is plotted on the candlesticks of the share price.
- the green line indicates a bullish trend.
- the red line indicate the bearish trend.
Supertrend Indicator Setting
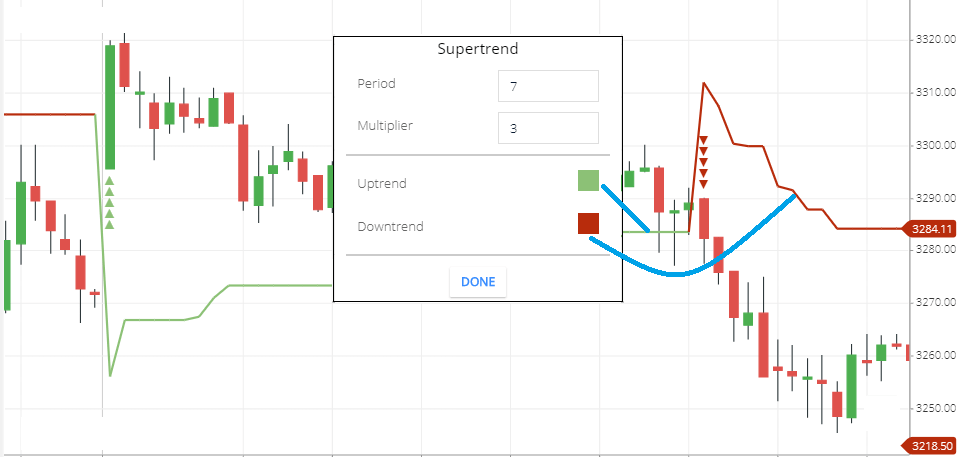
- Period: the default Period is 7. This means the 7-period share price will take to Calculate the trend line.
- Multiplier: the Multiplier value will be added to the Calculation and will plot above the candlesticks.
- Uptrend: this is the color of the uptrend line. In this trading chart, the uptrend line color is green.
- Downtrend: this is the color of the downtrend line. In this trading chart, the uptrend line color is green.
Calculation
Formula:
Supertrend Upper Line (RED line) = (High + Low) / 2 + multiplier × ATR.
Supertrend Lower line (Green Line) = ( High + Low) / 2 - Multiplier × ATR.
What Supertrend indicator tells you,
- This indicator tells you the trend of the market.
- The green line Formed below the candlesticks and red line Formed above the candlesticks.
- The green line Indicates the bullishness of the stock price.
- The Red line indicates the bearishness of the stock price.
- Also, the green line is giving you a support zone of the bullish trend. And Similarly, Red Line is giving you a bearish trend support zone.
Supertrend Indicator Trading Strategy
Strategy 1:
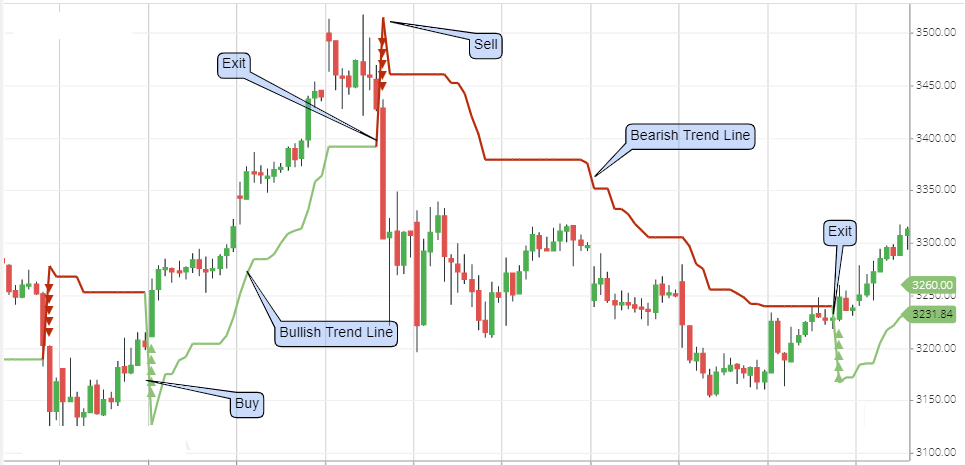
- This is the trend following Indicator. It will tell you the trend of the securities.
- The green line indicates a bullish trend and Red line Indicate the Bearish trend.
- If Line-color Changes Red to green. Then you can buy the stock.
- and when the green color changes to Red, then you can sell the stock.
Strategy 2:
To get more correct buy and sell signal, you can use RSI Indicator with the Supertrend indicator.
In the RSI indicator above 50 level of RSI is a bullish trend. And below 50 level of RSI indicates a bearish trend.
Buy signal: when the Supertrend line is green and the RSI is crossing above the 50 level. This is the buying signal.EXIT: when the green line color changed to the Red line and started forming above the candlestick.
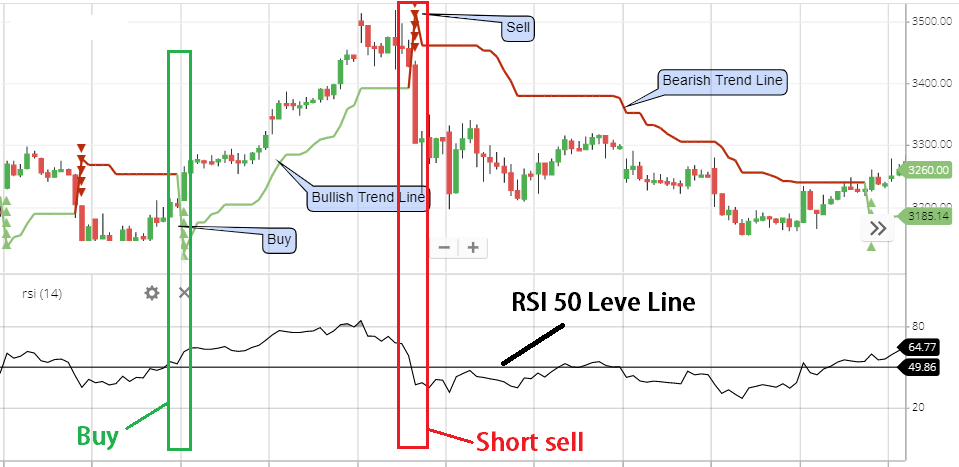
Sell signal: when the Supertrend line is Red and the RSI is crossing below the 50 level. This is the selling signal. Exit: when the RED line color change to green and started forming below the candlestick you can exit from the stock. because this means the trend changed.
Conclusion
The Supertrend Indicator will tell you, the securities trend. It draws a line on the candlesticks. And the line color and Position with the changing of the trend.
If the trend is bullish the green line will be formed below the candlesticks. If the trend is bearish the Red Line will be formed above the candlesticks.