Time series Forcast indicator ( TSF) is used to tells you, the future trend of the share price of the stock base on the previous price activities.
TSF line is plotted on the share price candlesticks and tells you the future price actions. The TSF indicator line is based on linear Regression Forecast Indicator.
Time series Forcast indicator setting
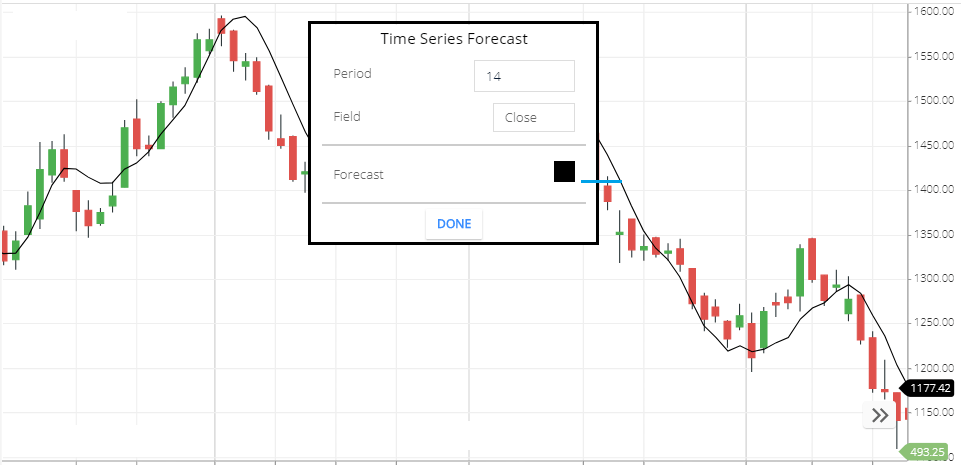
- Period: The 14-period share price will take to calculate the TSF line. the TSF line is based on the linear regression indicator. the Time series forecast is plot last point of the linear regression indicator and draws a line which is the TSF line.
- Field: the filed means the period’s price taking point. filed ‘close’ means the period or candlesticks closing price will take to calculate this indicator. another type of field price also available like ‘open means the opening price will take to calculate this indicator. or high low and etc.
- Forecast: this is the TSF line color setting. you can change the line color.
TSF indicator calculation
The time series forecast indicator is calculated by the linear reg forecast (LRF) indicator.
The last point of the LRF indicator line is plotted on each candlestick and draw a line. and draw a line.
The LRF Line is calculated by the least square fit method.
When the share price is above the indicator line which indicates the bullish trend and the continues of the trend. this is calculated by the previous 14-period stock price be the least-square fit method.
Similarly, if the stock price is below the share price below the indicator line, this indicates a bearish trend. the indicator line is calculated by the 14-period share price using the least square fit method.
What TSF tells you
The indicator line is plotted on the security price candlestick and tells you the future price of the securities.
Time series forecast indicator trading strategy
- When the indicator line is below the share price candlestick. this indicates the bullish forecasted price. you can take a buying signal.
- When the indicator line is above the share price price. this indicates the bearish forecasted price. you can take a short sell position.
Conclusion
The conclusion of the time series forecast( TSF) indicator is this will help you to assume the future trend of the share price. so that you can take a position and make a profit.
*Read Related Post For more information.