Trade volume index (TVI) used to tell you, the accumulation (buy) and distribution ( Sold) of the stock price with the help of ticks chart and traded volume of the share price.
TVI indicator is calculated by the tick chart. when the asking trade at a higher price then measure as buying or accumulation and when the biding price is at a lower price then this measure as selling or distribution.
Trade volume index setting
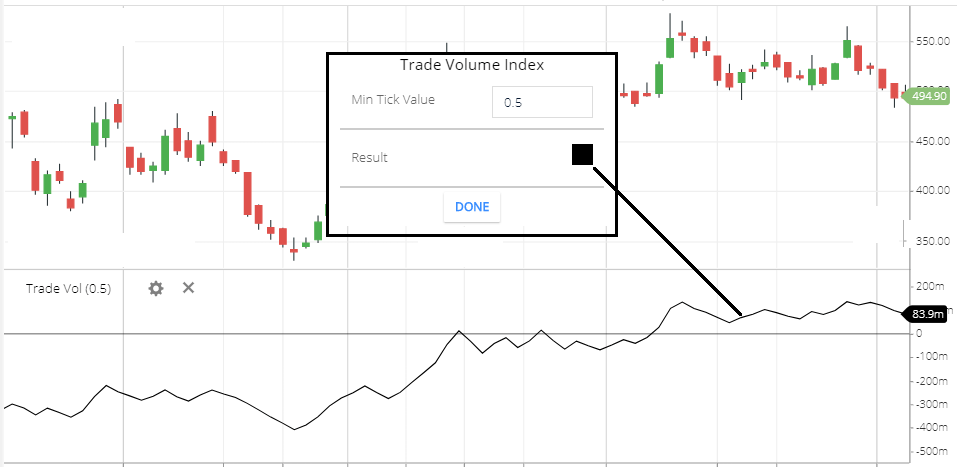
- Min Tick Value: this is the min tick value. the default value is 0.5.
- Result: this is the indicator color setting.
TVF indicator calculation
- This indicator is calculated by the trading.
- Changes = Substrating extreme price from the price since direction changed.
- If the changes value if greater than Minimum Tick value, then Direction = Accumulation.
- If the value of the change is less than the Minimum Tick value, then direction = Distribution.
- If changes are less than or equal to the minimum tick value or changes is greater than or equal to the minimum tick value, then direction = last direction.
Formula:
if the direction is accumulation then Trade volume index = Previous TVI + Volume.
if the direction is distribution then trade volume index = previous TVI - Volume.
What TVI tells you
- The trade volume index tells you when the indicator is moving up. This means the stock price is accumulated.
- When the Indicator line is moving down, this means the share price id distributed.
Trade Volume Index Trading Strategy
- Buy signal: when the TVI line is rising up, this indicates the more buying order moving the share price. And the share price will rise more.
- Selling Signal: when the TVI line is moving Downward direction, this is the indication of more selling order moving down the share price. And the share price may fall.
- If the share price is flat and the indicator line is rising. This indicates the share price may Break the Resistance level. So share price can rise.
- If the stock price is flat and the indicator lone is falling. this indicates the share prices may break the support level. So share price can fall below the Support level.
Conclusion
The trade volume index is giving an indication of the accumulation and distribution of the share price.
Accumulation means when more buying orders take place and that will push the share price to rise. And distribution means when the more selling order takes place and that will push the share price to fall.
*Read Related Post For More Information.