Typical Price indicator or TP Indicator is the average of every period high, low, and closing prices. Or in simple words, this is the average of high, low, and close of every share price candlesticks. And will draw a line with each Period Averages values.
TP indicator is consists of two components. 1) Typical price 2) value bar of this indicator. ( Which is located right of the chart).
TP indicator Setting
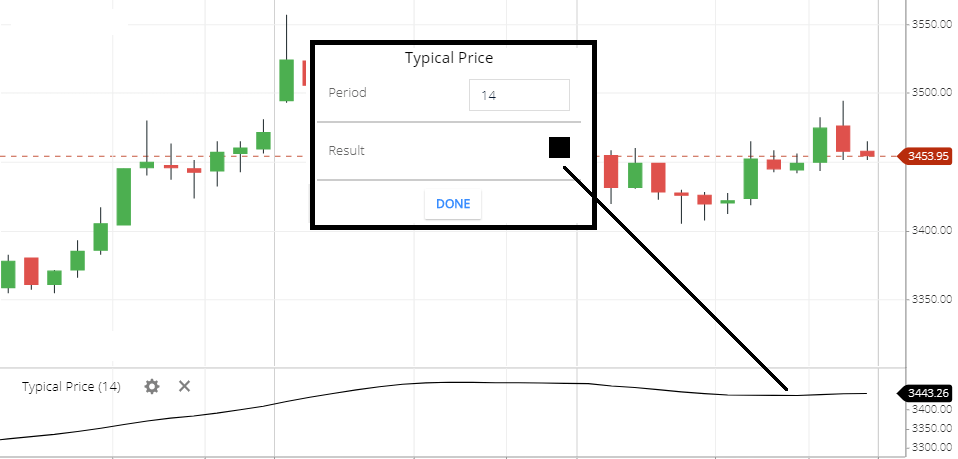
- Period: the default value is 14. This means this indicator will calculate the last 14 period’s each candlestick high, low’s and closing prices averages then will all the 14-period Average values average line will be drawn in the chart. Are you confused? To know more read how this typical price indicator Calculates.
- Result: this is the TP line color.
Typical price Indicator calculation
Typical Price Formula = current period high + current Period low + current period close) /3.
But this Indicator will show the Average of 14 periods high low and closing price values.
14 period typical price line Calculation is:
- First, Calculate last 14 period’s each candlesticks typical price separately [(high+ low + close/3)]
- then sum each candlesticks TP value of 14 periods.
- Then divide the result by 14. This is the value of this Indicator.
The formula of the 14-period line: (sum of 14 Periods each candlesticks TP value /14).
What TP indicator tells you:
- TP will tell you the average price of the high low and closing price. Some Traders use a typical price rather than the closing price. Because typing price consists of all three important values (high low and close). That’s why This value is useful.
- The indicator default value is 14. This means the 14-period Average TP value will be shown. And this will tells you, the 14-period Average movement of the stock prices.
- If you want to show the current period ( candlesticks) high, low, and closing price average, then change the period value to 1.
- when the indicator line is rising, this means the low, high, and closing price is increasing. this means the share price is rising.
- and when the indicator line is falling, this means the high, low, and closing price is decreasing, this means the share price is falling.
Typical Price indicator Trading Strategy
- This indicator used to tells you the average trading price of the share.
- although, you can buy the stock when the indicator will rise. and sell when the indicator line will start falling.
- if the share price is touching higher high and the indicator line is not touching higher high. this is the bearish divergence. the share price may fall. you can sell the stock in this situation.
- If the share price is touching lower low and the indicator line is not touching lower low, this is the bullish divergence. the share price may rise soon. you can buy the share in this situation.
Conclusion
The typical price (TP) indicator is a very useful indicator because it will show the average of the high, low, and closing price. this average price is better than the closing price that why some traders want to use this indicator.
The period high, low, and closing price contain the most important data that why TP value is important.
*Read Related Post For More Information.