The valuation lines indicator will show, visible chart’s average price.
Setting
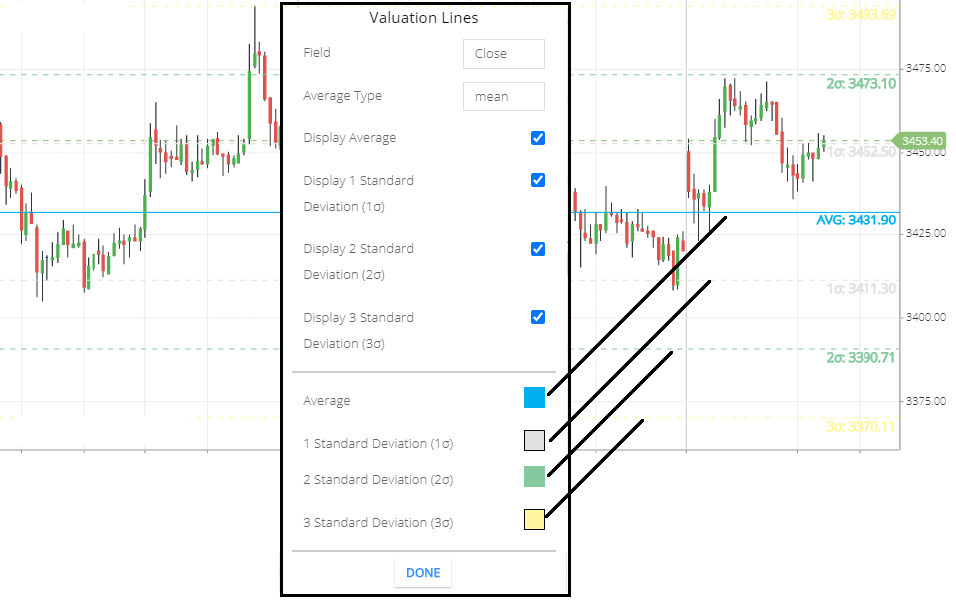
- Field: The default field is ‘close’ this means the closing price will take to calculate the average of the chart price.
- Average Type: the default average type is ‘ mean’. The average will be the mean average. Also other types available like (mean, median, Harmonic types of average).
- Display Average: check this option to see the average line.
- Display 1 standard deviation (1σ): if you want deviation lines then check this option. This is the 1 standard deviation line.
- Display 2 standard deviation (2σ): this is the 2nd σ line.
- Display 3 standard deviation (3σ): this is the 3rd σ line.
- Average: this is the line color.
- 1 standard Deviation (1σ): this is the 1st standard Deviation line color.
- 2 Standard Deviation (2σ): this is the 2nd standard Deviation line color
- 3 Standard Deviation(3σ): this is the 3rd standard Deviation line color setting.
The formula of valuation lines is= Average of the visible price of the chart.
How valuation lines indicator works
- this will display the average price line of the visible chart value.
- also, you can use 3 standard deviation lines of the valuation line.
Valuation Lines Indicator Trading Strategy
You use this average is as a support and resistance zone.
- when the average line is below the share price, then you can use this average line as a support level. if share price breaks the support line and moving down, then go for short sell.
- and when the average line is above the share price, then you can use this average line as a resistance line. if the share price move above the resistance zone. you can go for buying.
Use of the Deviation lines:
- you can use the SD line as a multiple support and resistance zone.
- above the average line is the bullish side and below the average line is bearish side. so you can use those lines as an entry and exit point.
Conclusion:-
Valuation Lines Indicator or VL is used to show you the average value of the visible chart price and also 3 Standard deviation lines will plot above and below the average line. and you can use those lines as a support and resistance zone.
*Read Related Post For More Information.