In my simple word, the vertical Horizontal filter indicator (VHF) tells you the market is trending or sideways.
Vertical Horizontal Filter Indicator Setting
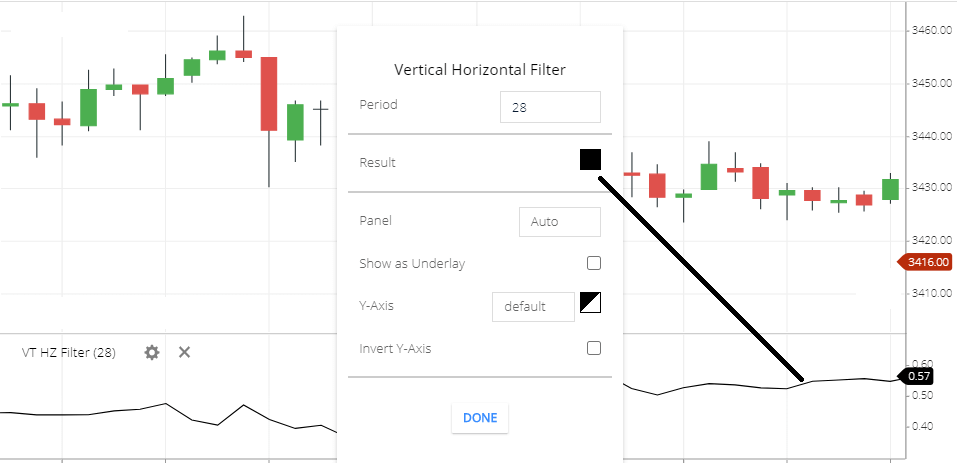
- Period: the default period is 28. means 28 period or candlesticks price will take to calculate this indicator.
- Result: The is the VHF indicator line color.
- Panel: this is the panel setting.
- Show as underlay: Let as it defaults setting.
- Y-axis: this is the default setting for the right side value bar of this indicator.
- Invert Y-axis: if you check this Y-axis value will invert.
What VHF indicator tells you:
- The VHF indicator consists of two components 1) VHF line and 2) right side value bar.
- this indicator tells you the stock is trending or in sideways.
- when the share price is trending then the indicator will rise up.
- and in the sideways market then the indicator line will fall down to normal. and if the market is sideways for a time then the VHF line will be flat.
Calculation
VFH indicator measure by using N periods absolute highest closing price – lowest closing price. then the result will be divided by the sum of absolute values of ( close [today] – Close [Yesterday]) for n Period.
The Formula of Vertical Horizontal Filter Indicator = ABS ( highest closing price of the n period - Lowest Closing price of the n period)/( sum of absolute values of (Closing price [today] - Close [yesterday]) for n period.
Vertical Horizontal Filter Trading strategy
- when the indicator is rising this means the market starts trending. And more rise means more strong trend. But this indicator will not tell you trend direction. So you have to find the trend direction from the price movement.
- So you can take buying Position when the stock is moving upward direction and the indicator price is also started rising upward.
- Similarly, you can take short-selling Position, when the stock is moving Downward direction and the indicator line is Moving upward.
Conclusion
Vertical Horizontal Filter Indicator or VHF indicator help you to find the trend. When the stock is in trend then the indicator will rise up.
And other times VHF line will be fall to the normal and a flat line will be formed. This indicates a sideways market.
*Read Related Post For More Information.