Volume oscillator is the difference between a short time period and a long time period moving averages of the volume then the result will be divided by the short moving average of the volume.
Setting
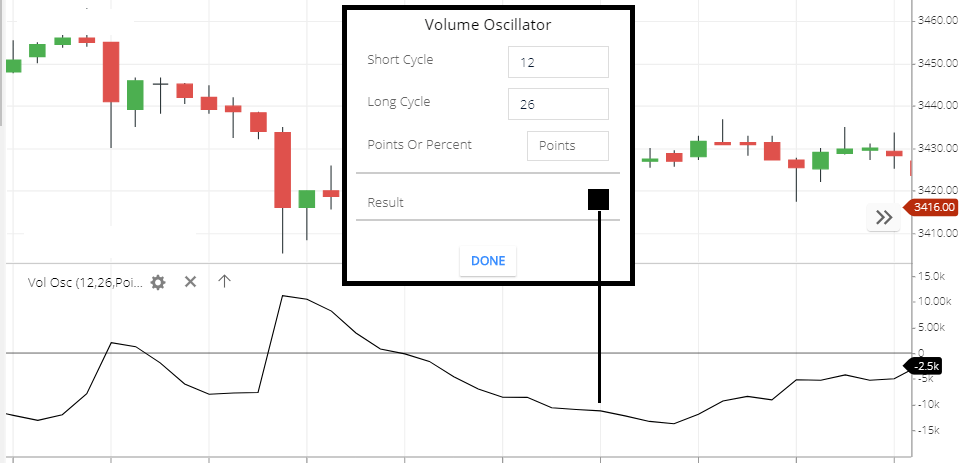
- Short Cycle: This is the short cycle period and the default value is 12. this means 12-period volumes will take to Calculate this indicator line.
- Long Cycle: This is the long period and the default value is 26. This means the 26-period Volumes will take to Calculate this Indicator line.
- Points or percent: the difference between the short cycle and long cycle period and the result will show in points ( means numbers) or in percent ( means percentage changes).
- Result: this is the result line. This means this is the Volume Oscillator line.
Calculation
- VO indicator uses two moving average of volume. 1) short period moving average of the Volume. 2) long period moving average of the Volume.
- Then substrate the long period moving average from the short period moving average. And the substrated value will be divided by the short period moving average. And the divided value will be multiplied by 100.
Volume oscillator formula: [{(short period moving average of the Volume - long period moving average of the volume)/short period moving average of volume}×100]
What Volume Oscillator indicator tells you,
When the indicator is above the zero line, this indicates short term volume Moving Average rises above the long term volume moving average. This means the short term volume is higher than the Long term.
And when the indicator is below the zero line. This indicates the long term volume moving average is higher than the short term.
generally in the bullish trend when the share price is rising then V oscillator also rising because the short period volume is increasing. and share price fall with the oscillator line because the short period average volume is decreasing.
similarly, in the bearish trend, generally, when the share price falling then the oscillator line will rise because the short time period volume is increasing. and when the price is started rising VO line will fall because of a short time period volume is decreasing.
also, this indictor tells you, when the share price and the volume is rising this means the more accumulation moving the stock to the upside direction. and when the share price is falling and the volume is rising this indicates more selling pressure moving the share price to the downward.
Conclusion
Volume Oscillator indicator uses to tell you the average volume is rising or falling, and this will be shown by the oscillator.
*Read Related Post For More Information.