Full form of the VWAP indicator is ‘Volume Weighted Average Price’.
The name itself tells you, the average price line which includes volume. that’s why the name of the indicator is volume-weighted average price( here calculation of this indicator trading volume important).
Simple moving average indicator, calculate some periods stocks average price, and draw a moving average line, which indicates stocks support and resistance zone. If stock trading above Simple Moving average line then SMA line work as a support zone and when stock trading below SMA line then SMA line work as a resistance zone.
Almost The Same thing For the VWAP indicator also. here the only Volume includes moving average line. changing the trading volume can impact the Volume Weighted Average Price line.
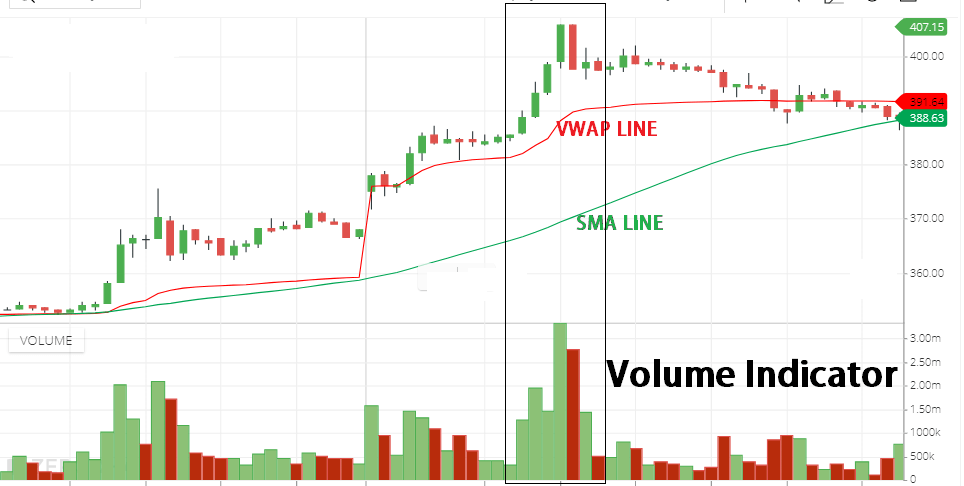
- If share and volume both increasing then the Volume Weighted Average Price indicator will Serply rise upward direction. because here calculation gives weightage to volume, so increasing volume that also increases to move indicator line to the upward direction.
- If share price Increasing and volume not increasing. in this situation, this indicator will move upward direction but not too much just because of the volume is not increasing.
- Similarly, if share price falling with high volume. Then this indicator will move downside too much. As compared to the normal SMA line.
- Or if share price little move upward But trading volume Increased too much. Then this indicator move upside compared to the SMA line.
VWAP indicator Setting
Go to indicator section and search for “VWAP”
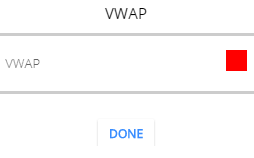
You can change the Line color. But one thing keeps in mind this indicator only works in below 1-day candle chart. So make sure your chart candle is below 1 day.
This indicator calculation between 9:15 am to 3:30 pm. So if you choose a 1-day candle then the Volume Weighted Average Price indicator will disappear. You can choose a candle time frame like 1 min, 2 min, 3 min, 5 min, 4min,10 min, 15 min, 30min, 1 hr,2hrs,3 hr not more than this.
VWAP Indicator Trading strategy
- Using this indicator, if share price trading above the Volume Weighted Average Price indicator line then you can use this indicator line as a Stop loss. If share price hits this indicator line then you can exit from the share.
- If share price trading below this Indicator line then you can use this indicator line as a resistance zone. If share price break this indicator line ( Resistance zone). This may be a breakout of the stock. the stock price can gain more after Breakout.
- If share price trading above this indicator line and this indicator break this indicator line and share price moving down then you can short sell. And the share price may fall more.
Conclusion
VWAP (Volume Weighted Average Price) Indicator is a good indicator. You can use this. But one thing you have to keep in mind that the candle time frame should be below 1 day. 1-day candle chart will not support this indicator.
*Read Related Post For More Information.