Ehler Fisher Transform (EFT) indicator will tell you, Market Trend & price reversal with Buying and selling position.
EFT indicator has two lines ( One EG line & another is EF trigger Line). above the zero levels in this indicator is Bullish side, below the zero level is Bearish side.
Crossing of EF & EF trigger Line is the buying or selling signal.
Ehler Fisher Transform Setting
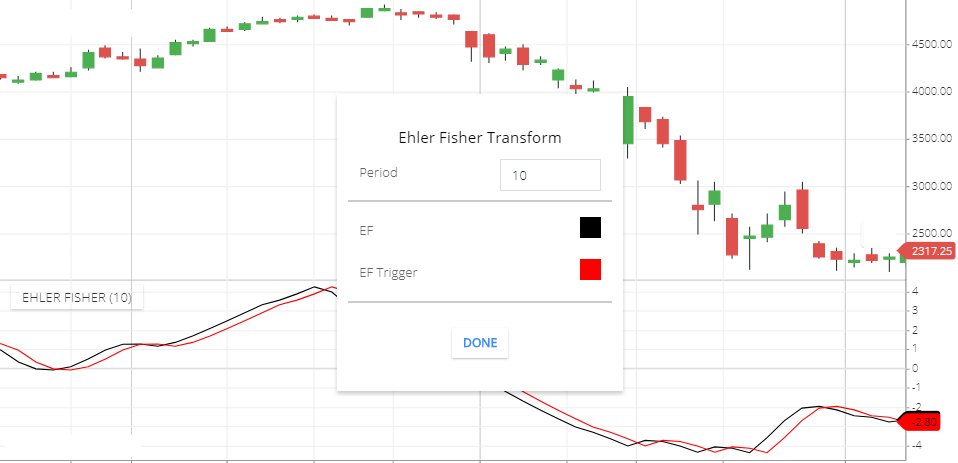
- Period: This is 10 Period by default. This means the EFT indicator will calculate by 10 Period price movement.
- EF: This is an EF line color. By default it’s black.
- EF trigger: This js EF trigger Line color. By default it’s Red.
What EFT indicator tells you: when EF Line (Black Line) crossing EF trigger Line (Red Line).
If EF indicator Line ( Black Line ) Is upside of EF trigger Line ( Red Line). That is the positive signal. If EF indicator Line ( Black Line) is below the ET trigger Line (Red Line). That is a negative signal.
Ehler Fisher Transform indicator Trading Strategy
- When EF Line (Black Line) crossing EF trigger Line (Red Line). This is the Buying signal. But if crossing below ‘0’ Line is in a negative trend. So you can wait for some time until the Indicator line moving Above the ‘0’ line. Above zero line you can buy a share if BlackLine is above Red Line.
- When Red Line crossing Black Line. This is the Selling signal. But if Crossing Above the ‘0’ line is in a positive trend. So you can wait for some time until the indicator Line moving below the ‘0’ line. Below ‘0’ line you can sell a stock, if Red Line above the black line.
- In the Market Topside, if Red line crossing Black line. This is the signal of price reversal. And the share price can fall. So you can exit from the stock.
- in the market downside, if the Black line crossing the Red line .this is the signal, the share price can rise. So you can exit from the stock ( if you have a short sell position).
- EFT indicator is useful with a combination of MADC and RSI indicators. MACD looks like an EFT indicator so when both indicator give single then you can enter or exit from the stock. And Using the RSI indicator with this, RSI above or 50 levels is buying or selling signals. So RSI gives a signal with EFT indicator then you can buy or sell the stock.
Conclusion
Ehler Fisher Transform indicator tells you, buy, and sell signals with market trend. If the market trend is Bullish then you can buy stock. If the market trend is bearish then you can sell the stock.
*Read Related Post For More information