Bollinger Bandwidth indicator is the derivatives of the Bollinger band indicator. The name itself tells you that it will show you a bandwidth of Bollinger band. Whenever the Bollinger band is too wide, this indicator will rise. it indicates the volatility of the share price.
Bollinger bandwidth indicator setting
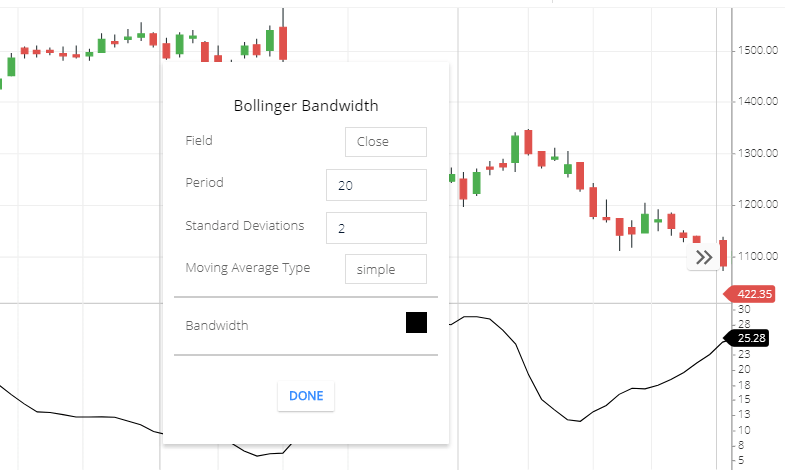
‘Settings
- Field: This is a certain time price that will need to calculate this indicator line. Means you can choose an opening, closing, high, lows, etc, etc time price to calculate this indicator.
- Period: Bollinger band indicator, by default, also uses 20 periods to calculate. Similarly, this indicator is using a 20-period price for calculation. Because this indicator is derivatives of Bollinger band indicator.
- Standard deviations: this is the standard deviations. It will deviate 2.
- Moving average type: this is to choose the moving average. like, simple moving average, exponential moving average, etc. By default simple moving average is good.
- Bandwidth: this is the indicator Line color.
Calculation
This indicator is calculated by the subtraction of the lower band from the upper band then divided the result by the middle band.
Formula of bollinger bandwidth is = (upper band – lower band )÷ Middle band.
Bollinger bandwidth indicator Trading strategy
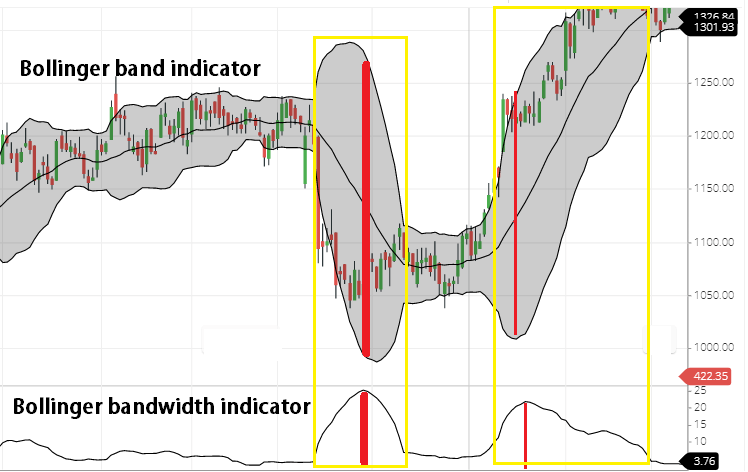
- See Above the chart. Here, I have attached the Bollinger band and Bollinger bandwidth highlighted the area. Whenever the Bollinger band is wider then this Indicator will rise.
- When the market is not volatile then this indicator Line will be flat. Bollinger band indicator upper and lower band is marrow then, this indicator will be flat in the lower side.
One thing. that I have to clear that Bollinger bandwidth Indicator is showing you a bandwidth of the Bollinger band. Or when the market is volatile then this indicator will rise up. This indicator will not help you to buy and sell positions.
Also, if price jump suddenly then this upper band and lower bandwidth will be high in that case this indicator will rise.
Conclusion
Bollinger Bandwidth is the Derivatives of Bollinger band. It helps to show the upper and lower bands’ position. If the upper and lower band is too close that is the band is marrow in this case also this indicator will be flat.
When the upper and lower band is wider then this indicator line will rise upward.
*Read Related Post for more information.