Awesome Oscillator indicator formed bars that indicate buying and selling Signal. Also, this indicator indicates a stock price strength & weakness.
This indicator has a ‘0’ line, above 0 line bars are on the positive side. and below ‘0’ line bars are on the negative side.
awesome Oscillator Indicator Setting
Go to Indicator section & search for ‘awesome oscillator’
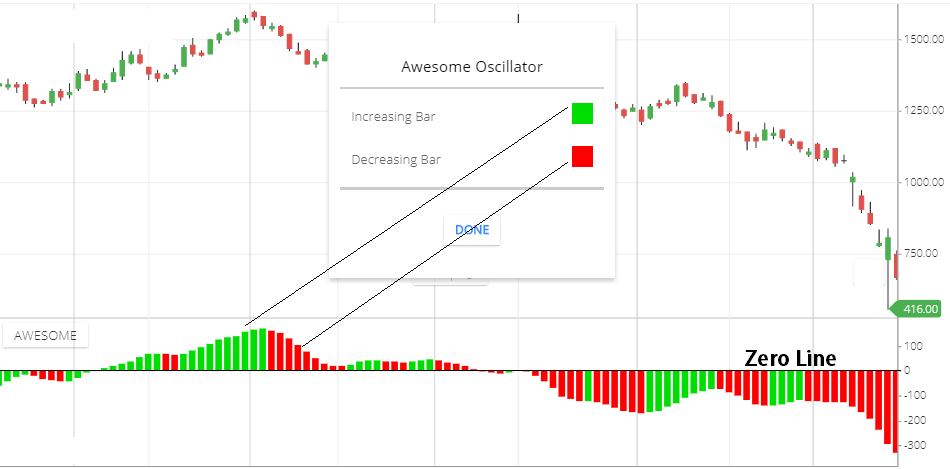
‘Increasing Bar’ color is ![]()
calculation
Awesome oscillator calculation is, using two simple moving average lines. The difference between the 34 Period SMA line and 5 periods SMA line is projected in the Awesome Oscillator.
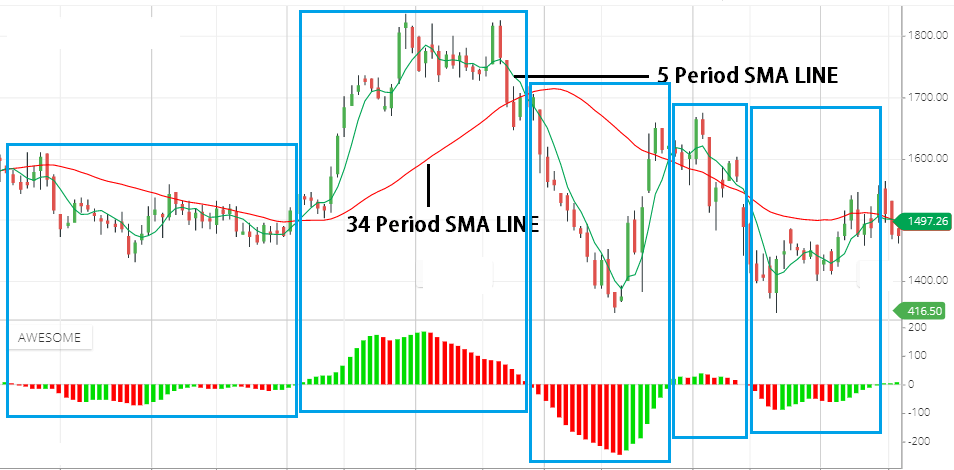
Above the chart, i have use 2 SMA line( 5& 34period). RED line is 34 Period SMA LINE & GREEN LINE is 5 Period SMA LINE.
Whenever 5 period SMA cross,34 periods SMA line then this is the buying signal ( which means last 5-period share price is stronger than last 34-period share price). Please see carefully above chart.
Awesome Oscillator trading strategy
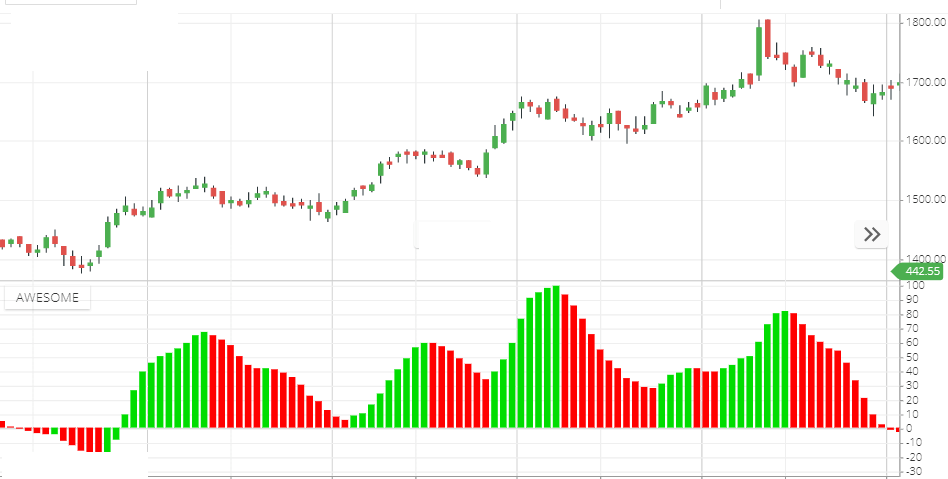
- This indicator has a ‘0’ line. Above ‘0’ line is the positive side.
- If Above ‘0’ line green bars formed. This is the bullish signal. More High green bar means the more bullish signal
- If above ‘0’ line red bar formed. This is the meaning of stock weakness. More high red bars mean more weakness.
- If below ‘0’ line red bars formed. This is the bearish signal. More high red bars means more strong bearish signal.
- If below ‘0’ line green bar formed. This is the meaning of stock price is getting stronger.
Buy Example:
If the awesome oscillator green candle formed above the ‘0’ line and gradually green bars Increasing. this means a bullish signal is stronger. The big green bar is the peak point of the share price after the pick point, the Share price will fall little for correction. Then the share price again started growing upward. If this indicator hit ‘0’ line and red bars formed in below ‘0’ line then you can exit from the share
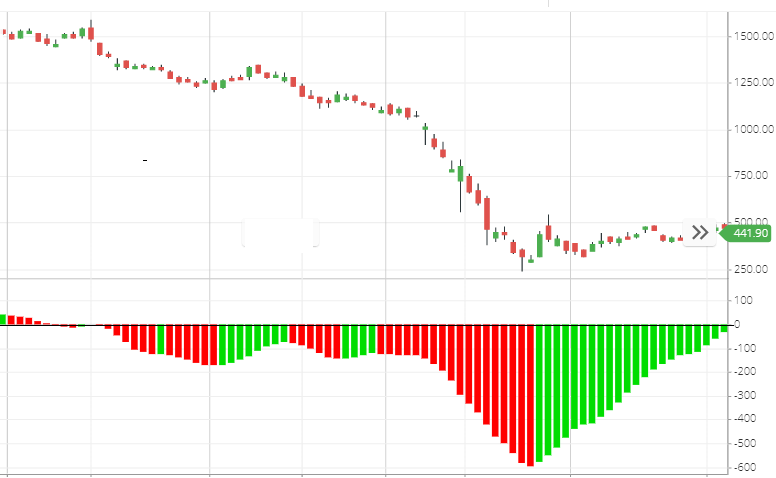
Short selling example:
Below the Chart, the awesome oscillator RED candle formed below ‘0’ line and gradually RED bars Increasing in the downside. this means a bearish signal is stronger. The big RED bar is the bearish peak point of the share price after the bearish side pick point, the Share price will gain little for correction. Then the share price again started falling downward. If this indicator hit ‘0’ line and Green bars formed in above ‘0’ line then you can exit (buy) from the share.
Conclusion
Awesome Oscillator indicator is the combination of 5period and 34 periods simple moving average line. this will indicate the buying selling position. in short and simple words, above ‘0’ Line is buying side & below ‘0’ line is selling side.
*Read Related post for more information.