Commodity Channel Index (CCI) is the difference between Current price and specific period average price.
Commodity Channel Index setting
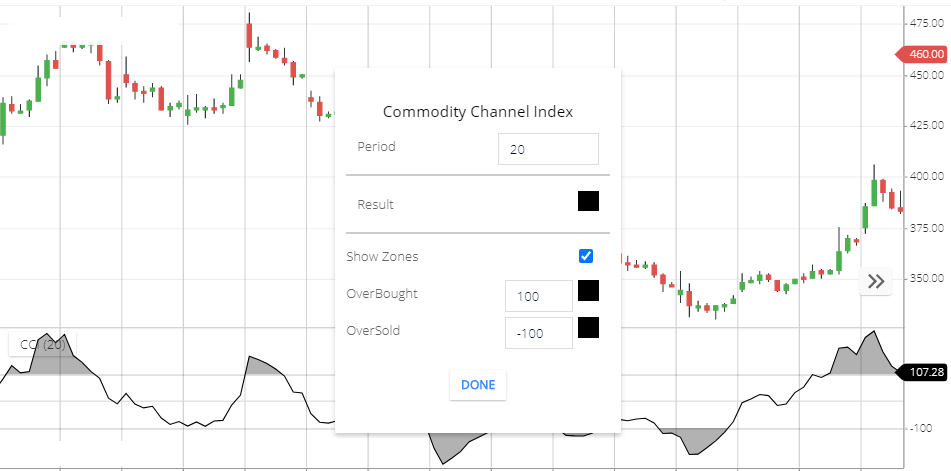
Go to indicator section & Search for ‘Commodity Channel Index’.
Setting
- Period: it’s 20 Means, 20 period Price will take calculate CCI indicator.
- Result: It’s CCI indicator Line color.
- shows Zones: If you check this, it will highlight the Overbought and oversold zones.
- Overbought: This is for overbought zone value & Color. By default it’s 100 and black color.
- Oversold: this is for oversold zone value & color.
What Commodity Chanel index indicator tells you,
- When the current price is higher than the specific Period average price, then the CCI indicator value will be high.
- When the current price is lower than the specific period average price, then the CCI indicator value will be Low.
- Above 100 level of CCI indicator is Overbought zone.& Below -100 level is an oversold zone.
Commodity Channel Index Indicator strategy
- If the share price goes above 100 level in CCI indicator, This Means, the share price may rise. So that after crossing 100 level. This is the buying signal.
- If the share price goes below -100 level in CCi indicator, This means, the share price may fall. So that after crossing -100 level. This is the short-selling Signal.
- If the share price and CCI indicator moving direction is the opposite. This is called divergence. This is the pre-signal of the CCI indicator. If share price rising & indicator moving downside. Then the share price will fall soon. If share price falling & indicator moving upside, then share price will rise soon.
Conclusion
Commodity Channel Index is the difference in the current price and the average price of a specific Period.
When this indicator Above +100 level, this is the Overbought zone, and then share price can give breakout, and price can go upside direction.
When this indicator below -100 level this is the Oversold zone. And then share price can breakdown and fall more.
*Read Related Post For More Information.