Choppiness Index Indicator tells you, the market is trending (not choppy) or sideways (Choppy).
When the market started trending, this indicator will show you the value of market trends.
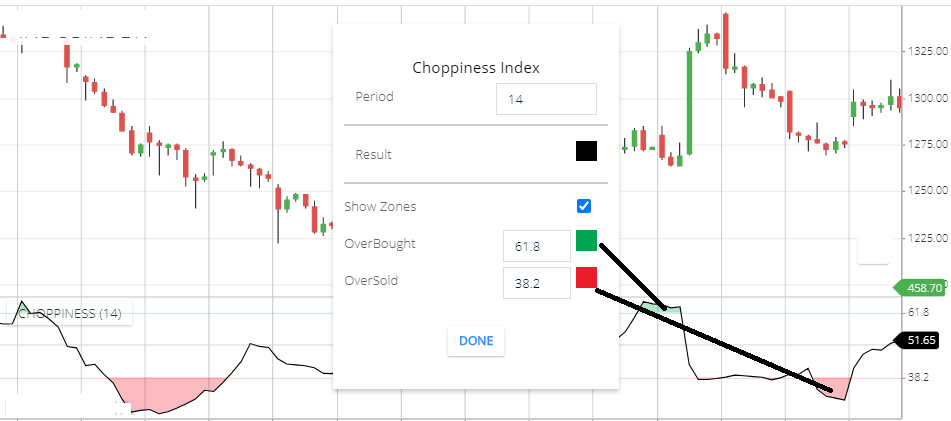
Choppiness index Setting
Go to indicator section and search for ‘Choppiness index’
Settings
- Period: by default value is 14 this means this indicator calculation is base on the last 14 candle price.
- Result: This Is the color of this indicator.
- Show zones: if you check this, the Consolidation zone & Trending zone will be cover by shadows.
- Overbought: This is the consolidation zone value and color setting. 61.8 is the default number of the Consolidation zone.
- oversold: This is the Trending zone value and color setting. 38.2 is by default value number of Trending Market.
Choppiness index indicator trading strategy
- This indicator move between 0 to 100.
- we can assume 50 levels is the midline of this indicator.
- if indicator line moving upward direction and crossing 50 levels. This indicates the starting of the ranging market.
- If the Indicator line moving downward direction and crossing 50 levels. This indicates the starting of the Trending market.
- When this indicator value above 61.8, this means sideways market.
- When Indicator value below 38.2, this means the trending market.
This indicator Tells you, trending market, but will not tell you the Direction of the trending market. So that you can use a combination with the RSI indicator. So that using RSI will tell you buying and selling signals. And Choppiness indicator tells you the market is in trending or not.
Conclusion
This indicator will help to Know the trending market. Mostly Big pocket indicators earn money in the Trending market. So that this indicator will tell, the market is in trending or sideways.
*Read Related Post for more Information.