In a simple word, Center Of Gravity (COG) Indicator tells you support and resistance zone.
cOG indicator Setting
Go to indicator search section and search for “Center Of Gravity”
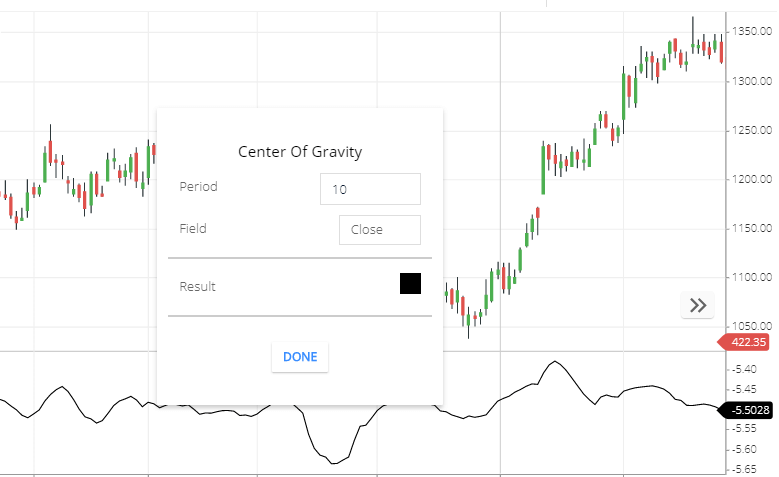
- Period: by default period 10, this Means 10 candle price will take to calculate this indicator line.
- Field: this is the price that needs to calculate this indicator line. By default, it’s the closing price. You can opening, high, low, etc.
- Result: this indicator Line color.
center of gravity indicator trading strategy
- COG indicator line moves with the share price movement.
- This indicator tells you the support and resistance zone. So that you can buy in a support zone and can sell at Resistance zone.
- Sometimes share price is rising and the COG indicator is not rising or moving to a downward direction, this is called bearish divergence. This is the signal that share prices can fall.
- sometimes share price falling and the COG indicator is not moving to the downside or the COG indicator line is flat or moving upward direction. This is the Bullish divergence. This is the signal that share prices can Rise.
Also, you can use RSI Indicator with COG(see below the chart, I have highlighted the area). So that when the COG indicator gives a buying signal, then you can check the RSI zone. also, If RSI above 50 zones, Then you can buy the share.
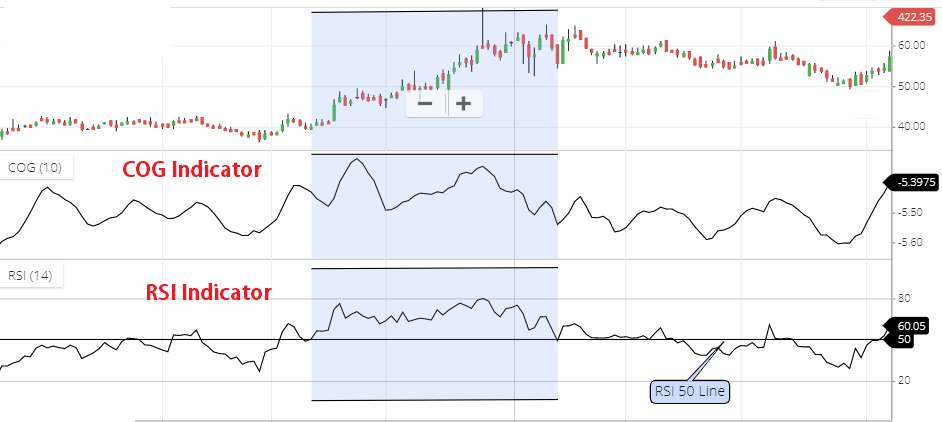
Similarly, when this COG indicator gives a selling signal then, you can check it in the RSI indicator. If RSI is below 50, Then you can Short sell.
Conclusion
The Center of Gravity indicator is used to find support and resistance zone. This indicator is quite a smooth Indicator. if stock going up direction then, you can buy in a support zone, and after touching Resistance zone if share moving to the downside direction you can sell.
*Read Related Post for more information.