Gator Oscillator is the derivatives of alligator indicator. This will detect the presence of trends.
Gator Oscillator will tell you,
- When the market is sleeping ( not trending)
- Awakening (the sign of not trending to trending market)
- Eating of alligator ( when the market is trending)
- Fill out ( when trending market about to end)
Gator Oscillator setting
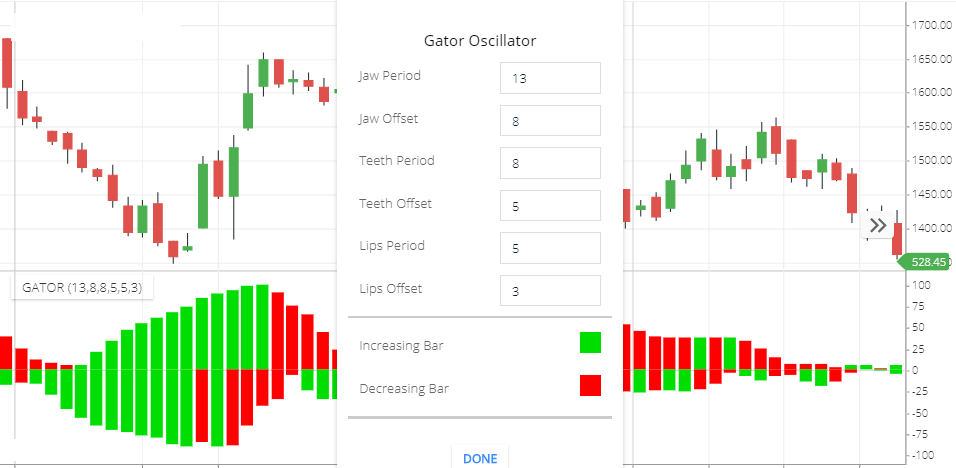
Settings
- Jaw Period: The number of the jaw period is 13. Jaw value will be calculated by 13 Period SMA line
- Jaw offset: offset number will be added with the SMA line. Jaw period added with 8 offsets value.
- Teeth Period: Teeth period value will be calculated as an 8 period SMA value.
- Teeth offset: 5 teeth offset numbers will be added with teeth period value.
- Lips Period: The number of the Lips period is 5. Lips period value will be calculated as a 5 period SMA value.
- Lips offset: 3 Lips offset numbers will be added with lips period value.
- Increasing Bar: When the Histogram bar’s value is higher than the previous bar, that is increasing bar. This is the color of increasing Bar.
- Decreasing Bar: when the Histogram bar’s value is less than the previous Bar, that is the decreasing bar. This is the color of the decreasing bar.
How Gator Oscillator Work
Gator Oscillator is derived from alligator indicator. So this is supplementary of alligators.
Histogram bar formed by the difference of jaw, teeth, and lips lines,& the value will be formed as a histogram bar.
Jaw, Teeth & Lips is the simple moving average of 13,8 &5 with the offset value of 8,5 & 3.
Formation of Histogram Bars above the zero line:
Above the Zero line Histogram bar will be formed by the difference between Jaw & Teeth value. Increasing the height of the Histogram bar depending on the difference of Jaw and Teeth value. For example, jaw value is 10 & teeth value 7, Then the difference is 3, so above the zero line Histogram bar will be formed height of 3 value.
If jaw value is 10 & teeth value is 14. Then the difference is 4. So above the zero line Histogram bar will be formed with a height of 4 value. if jaw & teeth value is Increasing compared to the previous value then a Green Histogram bar will be formed.
If the difference of Jaw & teeth value is decreasing compared to the previous value then the Red Histogram bar will be formed.
Formation of Histogram Bars Below the zero line:
Below the zero line, the Histogram bar will be formed by the difference between teeth & Lips value. Below the zero line, Increasing the height of the Histogram bar depending on the difference between teeth and Lips value. For example teeth value is 13 & lips value 8. Then the difference is 5, so below the zero line Histogram bar will be formed height of 5 value.
If Lips value is 16 & teeth value is 9. Then the difference is 7. So below the zero line Histogram bar will be formed with a height of 7 value. if the difference of teeth & lips value is Increasing compared to the previous value then a green Histogram bar will be formed.
If the difference between teeth & lips value is decreasing compared to previous value then the Red Histogram bar will be formed.
Gator oscillator trading strategy
This indicator has 4 phases. Sleeping, awakeness, eating & fill out ( steady).
In the sleeping stage market is not trending, so for a short moment of time you can buy and sell, if the market is properly ranging Bound.
In the awakeness stage, the market is formation is changing. This is the signal of the trending market. In this situation, you can wait for a little time until the market is in the trend. Or if you enter to stock then stop loss & risk-reward ratio should be managed properly.
Eating stages, this is the sign of the trending market. You can entry to the stock with proper money management and stop loss.
Fill out: This stage is the end of the trending Market. You can exit.
Understanding the stages:
- When the Histogram bar’s both side value is less. This is the sign of the market is sleeping (not trending).
- If Green bars forming continue both sides in the Histogram. this is the sign of market is awaking.
- High-value Green bar formation indicates the market is trending.
- After the formation of high-value green bars. If Red bar started forming this is the indication of the trending market is about to end.
Limitations
Gator Oscillator will not help you to find the direction of the trend. You can use an alligator indicator with this to identify a bullish or bearish trend. Or you can check price activities to find trend direction ( bullish or bearish).
Conclusion
Gator Oscillator is the derivatives of alligator indicator. It detects market conditions like sideways, sideways to trending, trending, ending of the trend.
*Read Related Post for more information.