Chaikin Volatility Indicator shows you market volatility. Chaikin Vol indicator Line move with market volatility. When Volatility increase this indicator will be in high value & when volatility decreased this indicator will be in low value.
Chaikin Volatility indicator setting
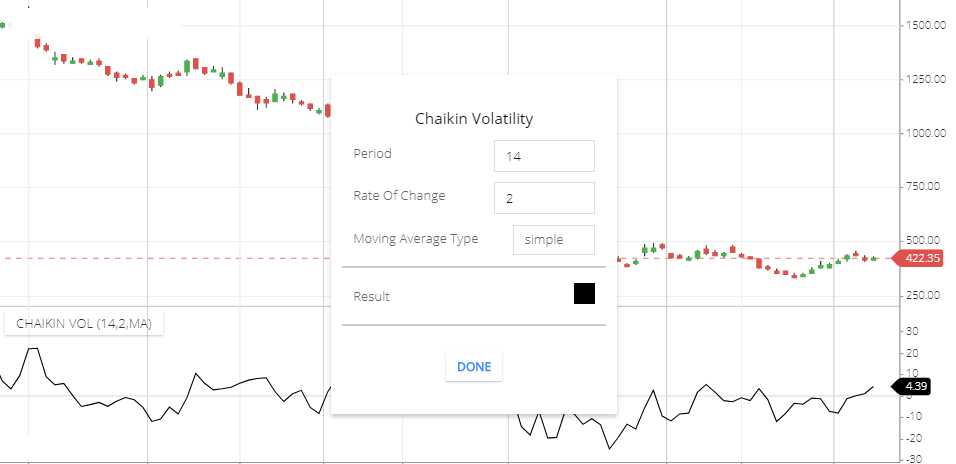
Go to Indicator search section and search for “chaikin Volatility”
Chaikin Volatility indicator trading strategy
This indicator Line will rise up in high volatility market & line value will be low in the low volatility market.
Chaikin Vol indicator in high-value means, share price traded in a wide range (the difference between High and lows, more high-value indicates more high lows difference ).
CV indicator in low-value means, share price traded in a narrow range (the difference between High and lows. more low-value indicates more constant price difference).
Increasing volatility in the market top in a short period of time indicates, trader’s nervousness & instability behaviors. because everyone wants to make a profit. when share price trading at the top position then exiting buyers get confused about whether the price will go up or correction will be started. in this situation some traders exit and some new trader buy share after seeing the previous price rising rally & share price will adjust in a correct valuation, where share price should stay. that’s why in the top position price volatility is high for a short period of time.
Similarly, decreasing volatility in Market Top over the long period of time indicates, Price is adjusted with valuation & waiting for rising again.
Increasing Volatility in the market bottom in a short period of time indicates the trader’s nervousness & instability behaviors & trader are selling for panic. & more trading activity means more volatility. and that will indicate in the CV indicator. in this situation the CV indicator line will rise up towards high value.
Similarly, decreasing volatility in the Market bottom over the long period of time indicates, Price is adjusted with valuation. In this situation traders aren’t interested in the stock.
Conclusion
Chaikin volatility indicator helps to show market volatility and tells you future price movement
.*Read Related post for more information