In The Simple Word, this Volume Chart Indicator Indicator Helps You To Know Trading Volume.
Volume Is The Most Valuable Thing In The Share Market. Because of Increasing Volume With The Price That Means More People’s Interest In The Share. Increasing The Volume Chart With The Price Is A Good Signal. That Means share is Sustainable with the current price. The Share Price May Not Fall.
If Share Price Falling With High Volume That Means Most Of The People Or Big Pocket People Selling huge quantities of Share. This Is The Sign that Share Price Can Fall More. Because When More People Or Big Pocket Investor Selling Stock because They Research Lot’s About Stock.so that They Selling Stock and In Future Share, Price Can Fall More.
This indicator is really necessary to know about share price strength.
volume chart indicator Setting
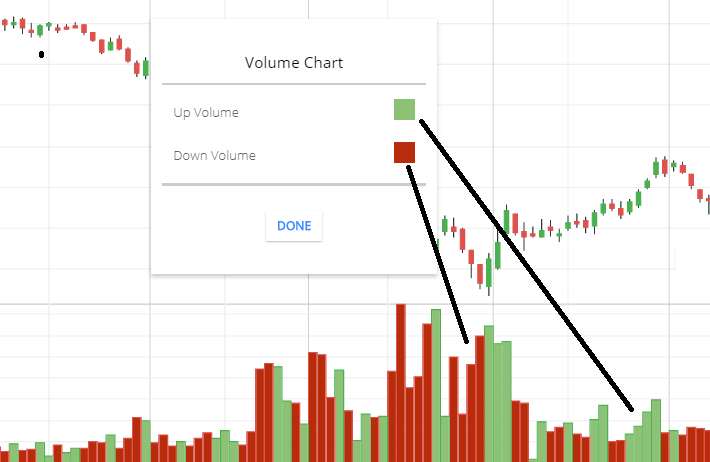
- Up: When more people buy shares then bars color will be Green. (This is the by default color, you can change bars color).
- Down: When more people sell share then bars color will be Red.
Calculation
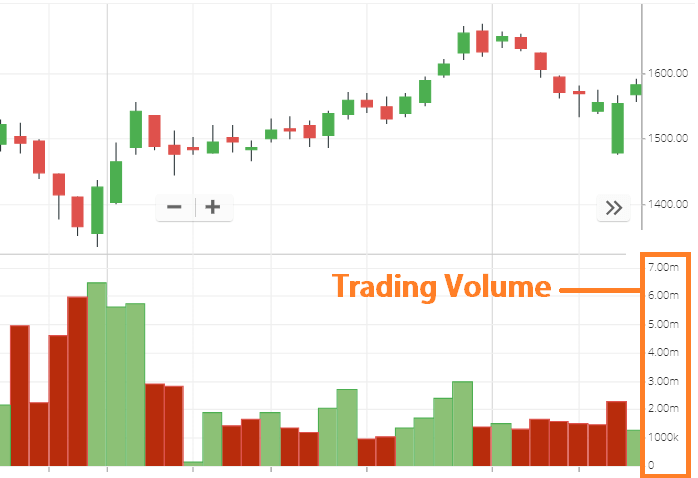
Not need any formula to calculate this indicator. On the right side of this indicator bars. You will see the numbers. So these are the number of trading shares. if chart bars touch 7.00m line that means 7 million shares traded within 1 candle Time period.
What this indicator tells you
This indicator is the most important indicator, you can see how much volume of share trade when the price is changing.
- If the bars are suddenly increasing, this means lots of trading happening in the stock compare to the previous period. that means something can happen in the stock price.
- if big investors enter or exit from the stock through the bulk deal, then you can identify this to see the chart.
- It will give you a historical trading volume idea of a particular stock in the chart.
- It gives you an idea of what traders doing in the stock. where the price going on in the high or low volume.
Volume Chart Indicator trading strategy
- if the share price is rising and the trading volume chart bars are not increasing then higher share price may not sustain for a long time. price reversal may soon.
- if the chart bars are increasing and no changes in the share price then share price can rise or fall soon.
- if the bars are increasing and the price is also increasing, this means lots of traders or big traders buying the stock. and share price can sustain in the higher value. ( but sometimes this can be wrong also)
Conclusion
The volume chart indicator is an important indicator that you should use this. Increasing or decreasing trading volume will give you the best information on share price, upcoming movement, and future price also. if big investors invest in a stock that means the future price can be increased. If big investors exit from the stock that means share future may not good. you can track it on the chart.
The bulk deal happened in the open market. so any big changes happening to the market you will understand by this indicator.
If share price increasing without volume Increasing that time share price may not strong. Share prices can fall anytime.
*Read more post for more information.