In a simple word, ADX/DMX indicator is, This indicator helps you to find a trend in the market.
One thing I have to clear that throughout the article if I mention only ADX or DMX both are the same.
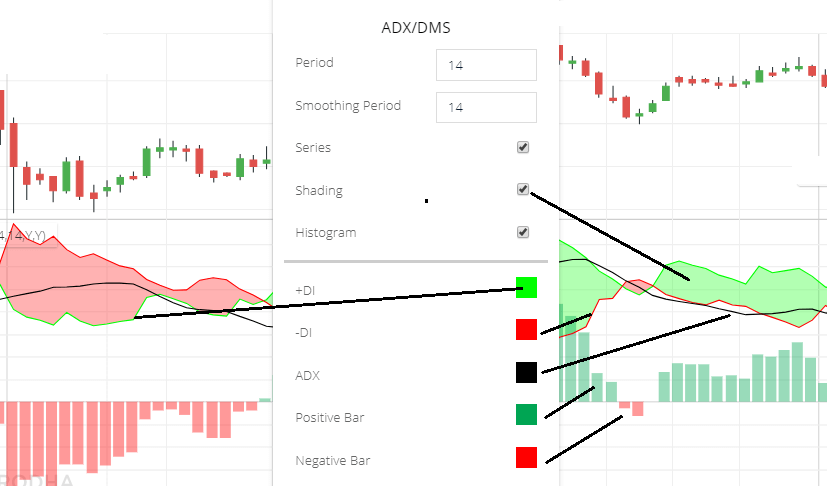
ADX/DMX Indicator setting
Go to indicator section and search for “ADX indicator”
Lets discuss settings options:
- Period: by default its 14 periods. This is the number of candles you want to calculate the Average Directional Index indicator.
- Smoothing period: this is also by defaults set 14 Period. This is for the Average Directional Index line. If you change no of periods then the ADX line position will change. 14 day’s Period is good for this line.
- Series: if you uncheck this series then +DI,-DI & ADX line will be hidden.
- Shaded: Gap between +DI & -DI fill with color. Check and uncheck this option to hide color between +DI & -DI.
- Histogram: check this to show the histogram bar in this indicator. If you don’t need a histogram to uncheck this.
- +DI: this is +DI line color settings.By default its green. You can change it if you want.
- -DI: This also color setting for -DI line.
- ADX: this color setting for the ADX line.
- Positive bar: this is for histogram positive bar color setting. By default its green. You can change the positive bar color.
- Negative Bar: histogram negative bar color. Here red selected.
ADX/DMX indicator Trading strategy
This indicator helps you to find a trend. If the Average Directional Index indicator below 20 level that means share in sideways.
If this indicator above 20 and more that means, the share is on-trend. Increase of ADX line that means the share is in trend. Below 20 means sideways market, 20 – 50 means good trend market. Above 50 means share price is unsustainable or can breakout.
If ‘+DI‘ line cross ‘-DI‘ line, then ‘+DI’ line going upward then this is the buy signal. But also you have to check the ADX line. If ADX line above 20 then you can buy it.
Similarly, If ‘+DI’ line cross ‘-DI’ line, then ‘+DI’ line going downward direction then this is the sell signal. But also you have to check the ADX line. If ADX line above 20 then you can sell it.
In simple words, the ADX line helps you to understand the market is sideways or in trend. And DI line helps you buy or sell signal.
Conclusion
Average Directional Index indicator is a good indicator you can mix this indicator with Volume, Bollinger bands. Etc etc.
If you use this indicator with Volume indicator then increasing price with volume give you more signal that share price can upward.
Using the Bollinger band with this indicator helps you (Bollinger band used in range-bound trading). If The ADX/DMX indicator gives a single market in trend then you can exit from Bollinger band.
One important thing in The ADX/DMX indicator, +DI with -DI crossing angel is important. If the crossing angle is high that means a strong stock trend. The crossing angle below the 25° angle is not a strong stock trend. More crossing angle means more strong stock strength.
*Read Related Post for more information.