ATR Bands indicate stock volatility by bands.
Average true range (ATR) means, an average of some periods high and low’s difference. here stock volatility cover by ATR bands.
- This indicator show range between high and low’s by bands.
- If ATR bands are too narrow which means the stock price is less volatile and after the increasing the gap between high and low’s, this is the sign of share price gain or fall(breakout or breakdown).
Some investors use this indicator to see breakout and breakdown points. changing narrow bands to wide bands it’s a sign of breakout or breakdown.
ATR Bands Indicator Setting
Go to indicator section> search for ATR Bands.
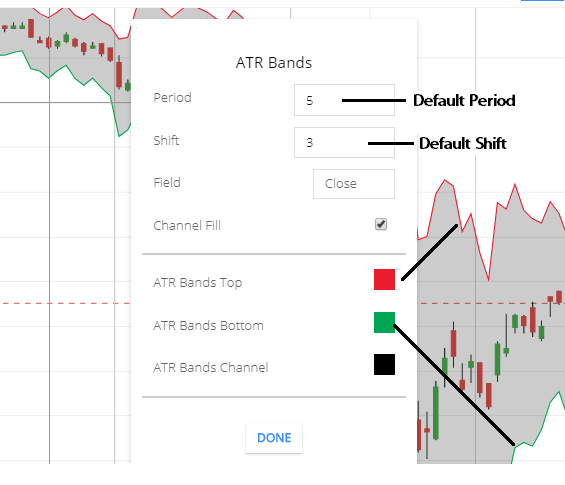
Lets talk about Options,
- Period: This is the default setting of this indicator, period means no of the candle used to calculate Average true range(ATR) bands.
- Shift: This also defaults setting.shift is the multiplier with the Average true range. Example: assume 5 Days average true range is 4. so, applying 3 multipliers (shift) with average true range(4). then the upper band and the lower band will be set (4✕3)=12 distance from average true range. Increasing or decreasing Shift number to change bands distance. Field: Click on “close” a full list will dropdown. ATR indicator is acting on price. so by default is acts on closing price but you can change to opening, high, low, etc, etc.
- Channel Fill: Bands channel will fillup by color. if you don’t want to fill bands channel by color then uncheck this.
- ATR bands top: this is color setting.you can change color. Upper band color red selected.
- ATR Bands Bottom: this is Lower band color green selected in this chart.
- ATR Bands Channel: This is channel color. as black color selected in the chart. also, make to check channel fill. if you uncheck channel fill then the color will not show in channel.
ATR Bands indicator Calculation
Average true range bands formula = current share price ± (ATR value ×  shift)
ATR upper band formula = current share price + (ATR value ×  shift)
ATR Lower band formula = current share price - (ATR value ×  shift)
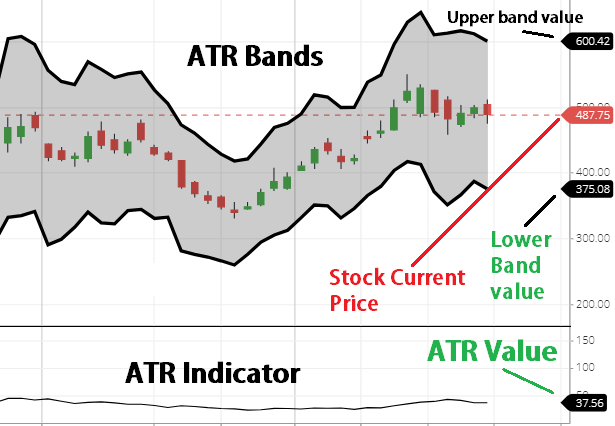
See above the chart,
here I have attached two indicators ( Average true range & average two range bands).so, I will calculate the average true range upper bands and lower band value.
you can see,
5-period average true range value is 37.56.
Current share price is 487.75
Default value is shift value is 3.
So,upper band = current share price + (ATR value ✕  shift)
 = 487.75 + (37.56 ✕ 3)
 = 487.75 + 112.68
 = 600.43
so,the upper band value will be 600.43
Lower band = current share price - (ATR value X  shift)
= 487.75 - (37.56 X 3)
= 487.75 - 112.68
= 375.07
so,the Lower band value will be 375.07
OR, you can calculate like = ATR value ✕ shift
 Bands value will be =37.56 ✕ 3
calculated value is=112.68
so, ATR Bands will be plotted, 112.68 value above & below from the current price.
Don’t get confused with upper bands or lower bands, using average true range bands indicator both upside and the lower side will cover by this indicator.
ATR Bands Trading Strategy
- If share price is continuously touching upper band, this indicate share price can give breakout & can rise more.
- If share price is continuously touching lower band, this indicate share price can give Breakdown. And fall more
- When share price is middle of the band this Means market is sideways.
- narrow bands indicates in future share price can give breakout or breakdown.
Conclusion
This indicator is good but without this indicator you can easily check stock volatility in the chart. also breakout or breakdown. using too many indicators will confused traders to take a decision.
*Read Related Posts for more information.