Klinger volume oscillator is designed to measure the trend of the money flow based on volume and price movement by using price and volume to highlight potential the longer-term trend direction of the market. it can also highlight shorter-term fluctuations of the market.
price movement is into account whether how the small price was move. The volume moves through every single market on every single movement. for calculating the indicator.this oscillator use closing price, high price, low price. the calculation is in the backgrounds the result is called Volume force ( VF).
Klinger Volume oscillator tells you
- the direction of the trend
- buy and sell trading signal
- bullish and bearish divergence.
Klinger Volume oscillator setting
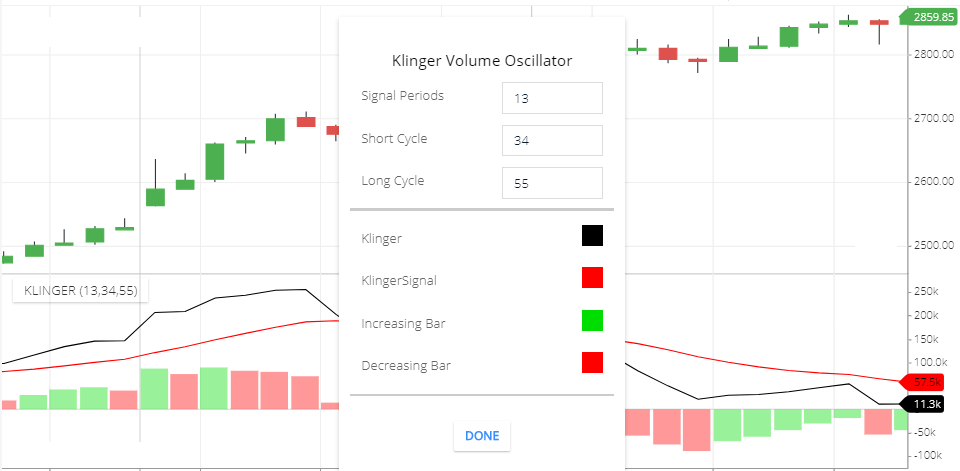
- Signal Periods: The 13 period moving average is the Signal line.
- Short cycle: this is the 34 period EMAs of the Volume forces.
- Long Cycle: this is 55 Period EMAs of the volume force.
- Klinger: this is the Klinger line color setting. The default color is black.
- KlingerSignal: this is the color of the SIgnal line. The signal line default color is black.
- increasing Bar: this is the histogram bar color. when price strength is increasing, the green bar will be formed.
- Decreasing Bar: this s the histogram decreasing bar color. The red bar indicate the weakness of the stock.
How Klinger Volume oscillator works
- The signal Line tells you buying and selling positions.
- Klinger Line shows the trend of the market.
- and Histogram shows price strength and weakness
How to trade with Klinger Volume Oscillator
above the zero line is Positive side & below the zero line is negative side.
Signal Line show buying and selling signals . When signal line is crossing 0 line and Klinger Line is above the signal line this is the buying signal.
if signal line is below the zero line and Klinger Line is below the signal line this is short selling signal.
If indicator and share price moving direction is opposite to each other . This is called divergence. When share price is falling and indicate is moving upward direction this is called Bullish divergence. This is the pre Signal of share price movement. Share price can rise.
If share price is going rising and indicator is moving to downward direction this is the Bearish divergence. Shate price can rise.
Limitations of this indicator
This indicator doesn’t show proper buying and selling signals. Also, the opposite movement of the share price and indicator line is not always a divergence.
*Read Related Post for more information.