MACD is the most popular and useful indicator for traders. In this article, I will discuss what is MACD indicator, Calculation of it, How to use it, Conclusion. I will try to discuss it in short and simple words. So read carefully this article so that your confusion will be clear.
What is MACD Indicator?
The full form of MACD is Moving Average Convergence Divergence. we will understand it by a very simple example.
So, let’s have an example: if a business 4 days earnings $10,$15,$15,$13 See second day’s earning increased to $5 compared to the first day. So, $5 increase on the second day compared to the first day.
3rd day’s income $0 increase. So the 3rd day’s income is flat Compare to the 2nd day.
4th day’s earning decreased $2 compared to the 3rd day’s earning. So this is the concept of the MADC indicator. Increasing or Decreasing price compare to the previous price is the signal of share price direction.
Sometimes share price increases but the change of price compared to other days in less.this will show the Moving Average Convergence Divergence Indicator.
If share price increase & change of share price also increased compared to the previous day that is the sign. share price can go upward. or If share price decreased & change of share price also decreased compared to previous days that is also the sign of share price can go the downward direction.
MACD Indicator Calculation
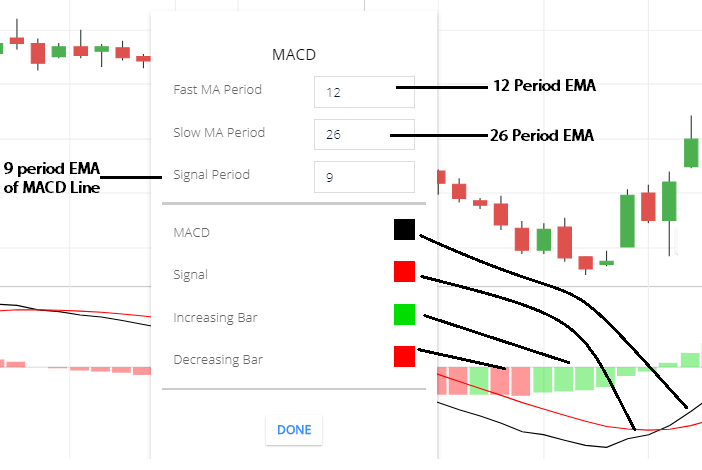
| MACD= 12 EMA – 26 EMA.. |
| Signal Line=9 Period EMA of MACD Line |
| Histogram= MACD Line – Signal Line |
Explanation: if i choose 1day time frame chart ( means, 1 candle=1 days chart) then 12day EMA – 26 day EMA = MACD.
Assume, 12 day EMA= 50 & 26 day EMA= 30 then Calculation will be = 50-30= 20. this means, last 12days share price is more stronger then 26 days.
If 12days EMA= 30 & 12 day EMA= 50.Calculation will be= 30-50= -20 .This means share price is weaker. 12 days share price is weaker than 26 days .
MACD indicator Trading strategy
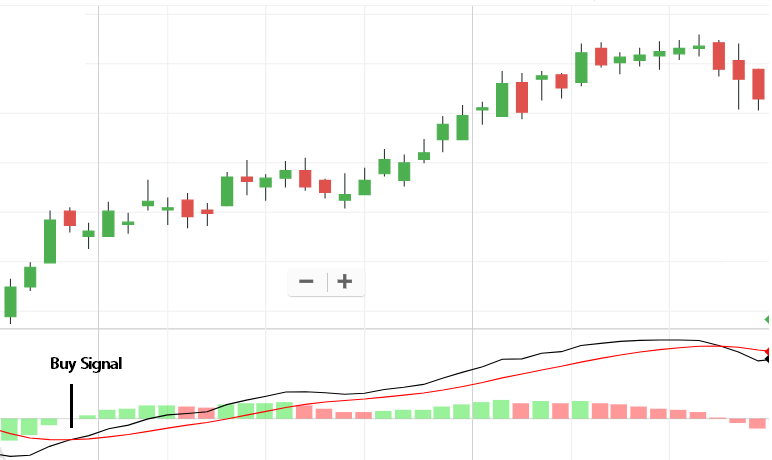
Buy Signal: If ‘MACD Line’ Cross ‘Signal line‘ then move in an upward direction. This is the Possibility that share price can gain. The crossing angle between the ‘Signal line’ and the MACD line is important. MACD Line cross Signal Line with high angel then this is the possibility that share price can gain.
.
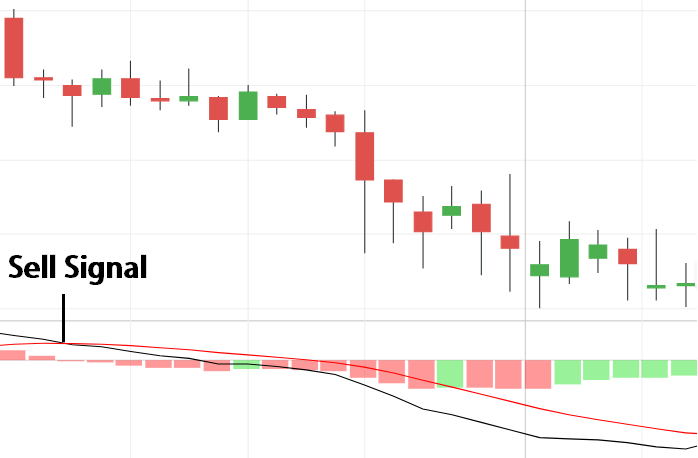
Sell Signal: If ‘MACD Line’ Cross ‘Signal line’ and move in a Downward direction. This is the Possibility that share price can fall. The crossing angle between the Signal line and the MACD line is important. If MACD Line cross ‘Signal Line’ with a high angle then this is the possibility that share price can fall.
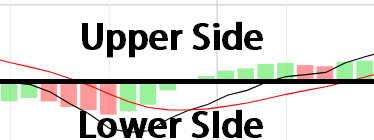
Also, After crossing ‘Signal Line’ if the MACD line goes lower side of the Histogram or if crossing with the signal line on the lower side of the Histogram that is also the More confirmation that share price can fall.
Conclusion
MACD Indicator is a good indicator. if you use this in a proper way then this indicator is very helpful for traders. this indicator shows you price strength compared to the previous price. most of the experienced traders use this indicator. One of the best indicator in the share market for technical analysis.
*Read the related posts for more information.