Moving average deviation ( MAD or MA DEV ) shows how share price deviated from the moving average (MA). And deviated value is shown by Histogram Bars.
MA Dev Setting
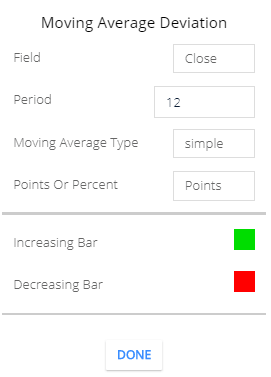
- Field: The Default field is ‘Close’. This Means share price candlesticks closing price will take to calculate the moving average (MA). Also, another field is available like candlesticks opening price, closing price, candle high, candle low price. Etc etc. ( Period and candlesticks or candle is the same).
- Period: The default period is 12. This means 12 candlesticks closing price will take to calculate the MA. And then the calculated price is called 12-period MA.
- Moving Average Type: Default moving average type is ‘simple’. The simple moving average calculation is easier. It takes a 12-period closing price and divides the total value by 12 periods. And the calculated value is a simple moving average value. Also other types of moving averages available like Exponential, Time series,, Triangular, variable, etc, etc.
- Point or Percent: The bar value will show the current price to moving average price deviations by point, or show you by percentage.
- Increasing Bar: this is the color of an increasing bar. when the share price is increasing, The green bar will be formed.
- Decreasing Bar: This is the color of the decreasing bar. When the share price is decreasing, the Red Bar will be formed.
Moving Average deviation Calculation
- Indicator Bars will be formed above the Zero Line when the share price is above the MA Price.
- Indicator bar will be formed Below the zero line when the share price is below the moving average price.
- A RED bar will be Formed when the share price is decreasing.
- Green Bar will be Formed when the share price is increasing.
- The substrating of the moving average price from the current price. The result value will be formed as an Indicator Bar. If the Substrated value is Positive then Histogram Bars will be formed above the zero line. And if the Substrated value is negative then the Histogram bar will be formed below the zero line.
Moving average deviations Histogram Formula: Current price – specific Period Moving Averages price.
Trading strategy
To better understand This Indicator you can read Moving Averages Indicator.
Buying strategy
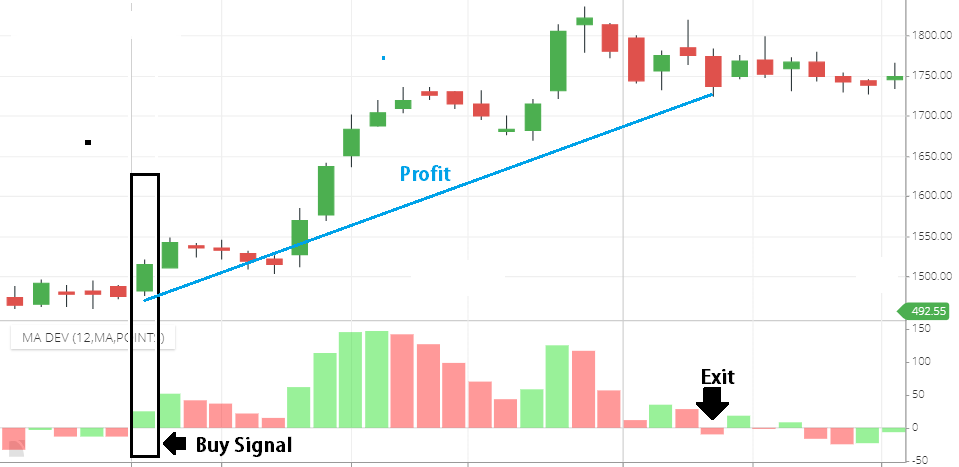
See above the chart, When the Histogram bar is forming below the zero line and gradually bars are forming above the “zero” line. This is the sign of bullishness. Increase the Bars value is to define the strength of the bullish trend.
- above the ‘zero’ line if Green bar forming, this indicates the strength of bullishness.
- If Red Bars started forming above the “zero” line, this is the sign of weakness in a bullish trend.
- If the RED bar continues forming then the bullish trend may end.
- You can exit from the stock when the indicator bar is forming below the ‘zero’ line.
Sell Strategy
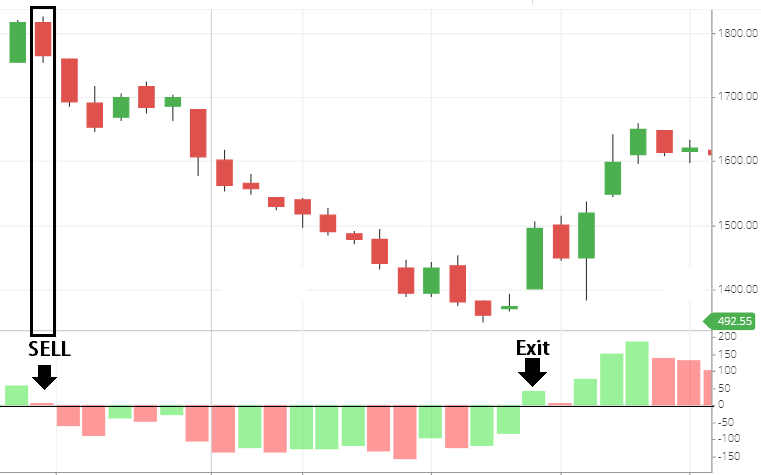
When Histogram Bars are forming above the zero line and gradually bars started forming below the ‘zero’ line, this is the sign of bearishness. You can sell when bars started forming below the “zero” line. And the increase in the bar’s negative value shows the strength of bearishness.
- And if the green bar started forming on the negative side. This is the sign of bullishness.
- Continuously green bar forming on the negative side is the sign of a bearish trend that may end.
- If Histogram Bar started forming above the ‘zero’ line, you can exit from the stock.
Conclusion:
Moving average Deviations is supplementary of the Moving Average (MA) indicator. It shows the deviation of the current price and Moving Averages price by Histogram Bars.
If you use the Moving average indicator then you will understand better about the MA dev indicator, for better understand I’m using 12 MA & MA Dev indicators below the chart…
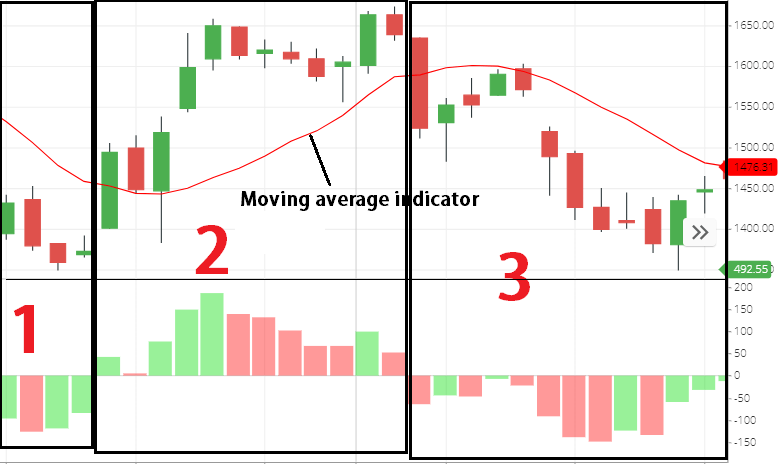
Above the chart i have divided the chart by 3 part,
- in the first one is, the histogram bar is forming below the zero line, and the share price is also below the MA line.
- the share price is above the MA line that’s why histogram bars forming above the ‘zero’ line.
- the share price is below the MA line that’s why the Histogram bar is forming below the zero line.
And the moving average line and share price Gap is the height of the histogram Bar, more between share price and moving average, then the more high-value bar will be formed.
*Read Related Post for more information.