Prime number bands (PNB) calculated by the nearest prime number of the period high and low’s. And plot bands on the share price candlesticks.
Prime Number Bands Setting
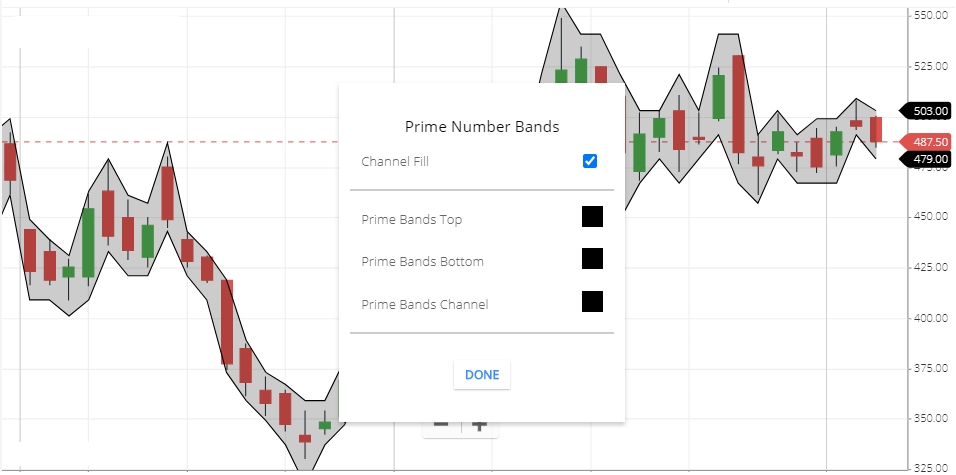
- Channel fill: Enabling this option the indicator’s upper and lower line gap will fill by the color. Channel means The upper and lower line gap.
- Prime Bands Top: This is the upper Band ( or upper line, top line) color setting. The default color is black.
- Prime Bands Bottom: this is the lower line (bottom line, lower band) color of this Indicator. The default color is black.
- Prime Bands channel: This is the color of the gap between the upper and lower lines. The default color is black. The color will show if you check the channel fill option Above.
What this PN bands indicator tells you,
- when the bands are moving upward direction, the market is Bullish Direction.
- If the bands are moving Downward direction, the market is in a bearish direction.
- if the bands are narrow that means share price is less volatile.
- if the bands are wide this indicates share price is volatile.
Prime Number Bands trading strategy
Strategy 1
When the channel(bands) is narrow at the high price point of the stock for a short period of time, this indicates the trend will be starting soon. if the channel is in the downside that means bearish trend. if the channel is moving upward direction. this is the bullish trend.
So, you have to identify the trend direction to see the channel direction.
Strategy 2
Use the PNB indicator with a combination of RSI.
When the PNB Indicator bands are moving upward direction, this is the bullish signal in the PNB indicator. And in the RSI Indicator, if the RSI line above the 50 level. You can take a buy position. If the RSI line is moving down below the 50 line of RSI exit from the stock.
When the PNB indicator bands are moving Downward direction, this is the bearish Signal in the PNB Indicator, and in the RSI Indicator, if the RSI line is Below 50. You can take short sell Position if the RSI line is moving Above the 50 line, you can exit from the stock.
Strategy 3
Sell signal: use alligator indicators with this indicator combined with the PNB indicator for better trading indication. In the PNB indicator channel tells you, when the channel is going to the downward direction, this is the bearish trend signal.
and in the alligator indicator when the jaw is above the lips and teeth and falling down. this indicates the bearish trend. so when both indicators are indicting the same bearish signal, then sell the share.
Buy signal: if the Prime Number bands are moving upside this is the bullish signal. and in the alligator indicator, if the lips line is above the teeth and jaw, this is the bullish signal in the alligator indicator. so if both the indicator confirming the trend is bullish. then buy the stock.
limitations of this indicator
prime Number bands plotted above and below the share price candlesticks base on the nearest prime number of the high and low’s, that why the indicator doesn’t tell you such signal of the share price. It only moves with the share price. And the nearest prime number will plot on the period high and low’s.
Although you can trade while the bands moving up or down, it indicates bullishness or bearishness.
Conclusion
Prime number bands are plotted above the below the share price candlesticks base on the nearest prime number of the high and low price. the channel will move with the share high and low price and indicate the trend & trend direction of the share price.
*Read Related Post for more information