Open Interest Not work in the Equity market, it will work in the derivative market, Commodity market. Because in the future and options market (derivative) market, buyer and seller can take Position this is the open interest.
Increasing the buyer and sellers position in the derivatives market, that will increase open interest and indicator line will move upward direction.
If the buyer and seller position is decreasing, then the indicator line will move downward direction.
OI Indicator line oscillates for increasing and decreasing of the OI value. On the right side, you can see the open interest numbers.
Setting
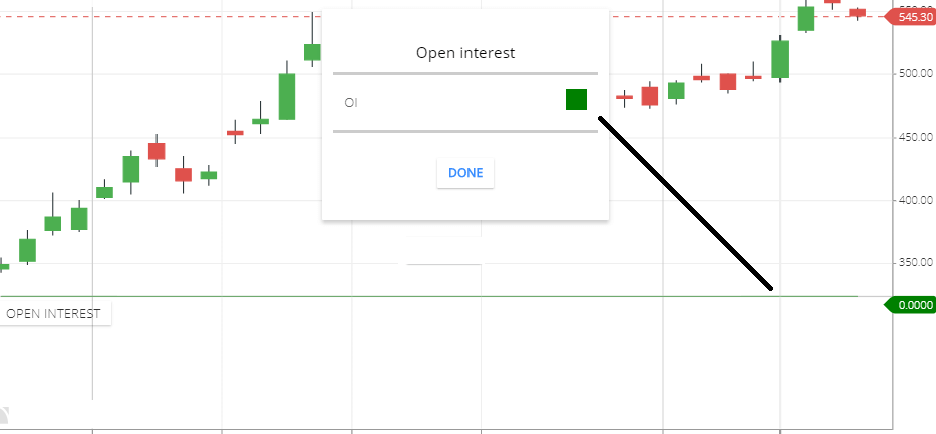
if you want to use this indicator in your trading software then search in indicator search section ” open interest” . so this will show to you. nothing you have to setup to use this indicator. only result option of this is for color of the indicator line.
What Open Interest indicator tells you,
In the future and options, market traders can buy or sell stock base on future prices. in the future if the share price is adjusted with the trader price level then you get profit.
If traders think share prices can rise in the future then the trader will buy the stock. If Trader thinks share price can falling in the future, then the trader will sell the stock. And the buy-sell combined interest will show by the indicator line.
Open interest indicator strategy
When share price and OI indicator both are increasing then share price can rise. Then go for buying. Because the price is increasing and more traders are interested in the stock. Then share price can rise.
If share price and OI indicator both are moving down. This is the signal that the trader unwinding the position, traders may lose interest in the stock.
If the share price is rising and OI is moving down, this means trader unwinding the position, the share price may not sustain, price reversal may be seen.
If the share price is falling and the OI line is moving upward, this means the price can change sharply, price direction unpredictable, but more chance is share price can rise, and less chance is the share price can fall.
Limitation of this indicator
This indicator is good for the future total positions of the traders, but it will not tells you buyer position and seller position separately. that why its tough to understand who buyers build up their positions, and how sellers building up their positions. this is the lack of this indicator.
This will not show you, the proper buying or selling position. also not help you to find trends.
OI indicator will not work in the equity market. if you use this indicator in the equity market then the indicator line will be flat.no value will show.
Conclusion
Open interest indicator is used in the derivative market and commodity market. when traders buy and sell base on the future price. if you use this indicator in an equity market then it will not show you the value buyers and sellers total trade positions.
*Read Related Post for more information.