In a simple word, the volume profile indicator tells you the traded volume of the visible chart on the price level. this means every price level traded volume will show.
For example, it will show every price level traded volumes.
Traded volume means when you buy or sell the stock, every transaction quantity is the volume. for example, if 4 traders buy the stock like this
- first trader 100
- the second trader buy 200
- 3rd trader buy 300 quantity share
- 4th trader buy 500 quantity shares.
that means the total traded share is 1100. and you can tell 1100 as a traded volume. and this indicator will show you the traded quantity the every price level.
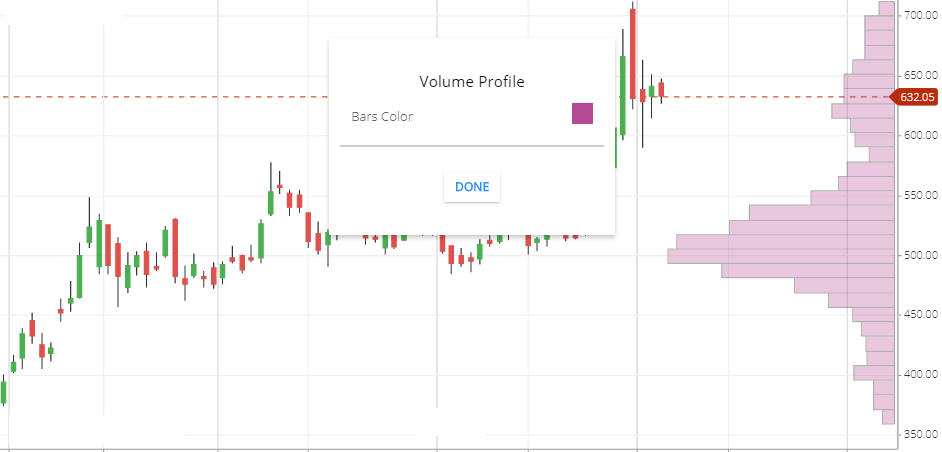
For example, the volume bar will show you every price volume. below the chart, you can see at the level of 500.00 the volume profile indicator is extended too much. this means the at the level of 500 more shares traded compared to the other price level.
How VP indicator works
It will show the visible chart traded volume of every price level, if you are zooming the chart then the volume profile bar can be changed because when you are zooming then less candle will be shown in the chart. and in the recent trader volume of the price can be different.
similarly, if you are the zoom out then you can see the difference of the indicator chart.
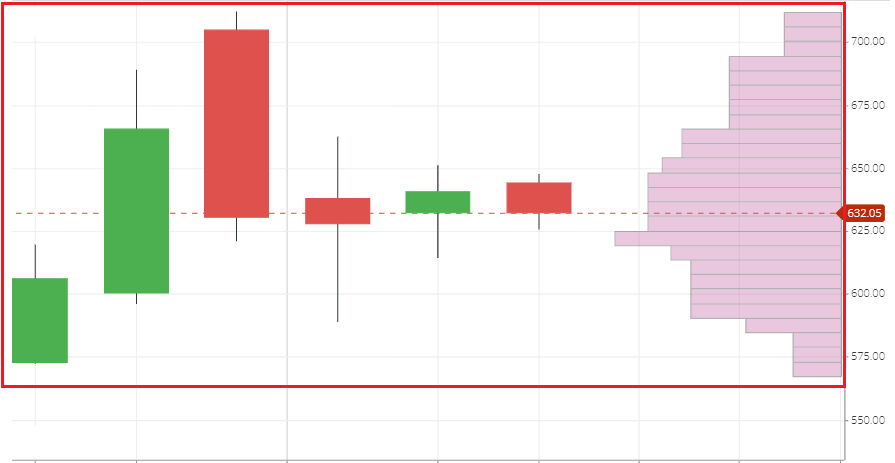
See above the chart, I have drawn a Red line border that means the indicator will show only visible charts price base volume. you can see the chart, near 625 share price the trader volume is higher compared to other level prices.
What Volume profile indicator tells you?
This indicator tells you when the volume profile bar is higher at the particular price level, that means when the share price rises to that position for the transaction of the shares is happening.
if more transactions happen is the particular share price that means maybe traders are taking profit on these prices or buying or on these prices. one of these scenarios can happen. but it’s difficult to understand what actually happening there accumulation or distribution. only you will understand more number of shares buy and selling happening at this price.
Difference between volume profile and Volume chart
| Volume Profile | Volume Chart |
|---|---|
| This will show you the traded volume of the price level. | This will show you the traded volume of every candlestick. |
| The volume profile indicator candle will extend when the traded volume is increasing price level. | The volume chart indicator histogram will rise when the traded volume increasing in the share price candle. |
| This will show you the whole visible chart traded volume at a price level. if you are zooming the chart then indicator candles can change. | This will show each time frame candlestick traded volume. that why if you zooming or zoom out the chart the traded volume will not change. if you change the time frame of the candle then it will change. |
| The volume shows based on the chart. | Volume show base on the time frame. |
| Uses are lower than the volume chart. | Most of the trader and generally when we talk about the volume that means we use volume chart indicator. this indicator uses more compared to the volume profile. |
Conclusion
Volume Profile you show the traded volume of the visible chart on the price level. this means the visible chart every price level traded volume will show.
*Read Related Post For More information.