Price oscillator (Price OSC) is the combination of the two Moving Averages. One is a 26-period exponential moving average and the other is the 12-period exponential moving average. And the difference between the two EMA’s value plotted as a Price Oscillator.
The crossing of the two Moving Average gives you a signal of buying and selling.
Price oscillator Setting
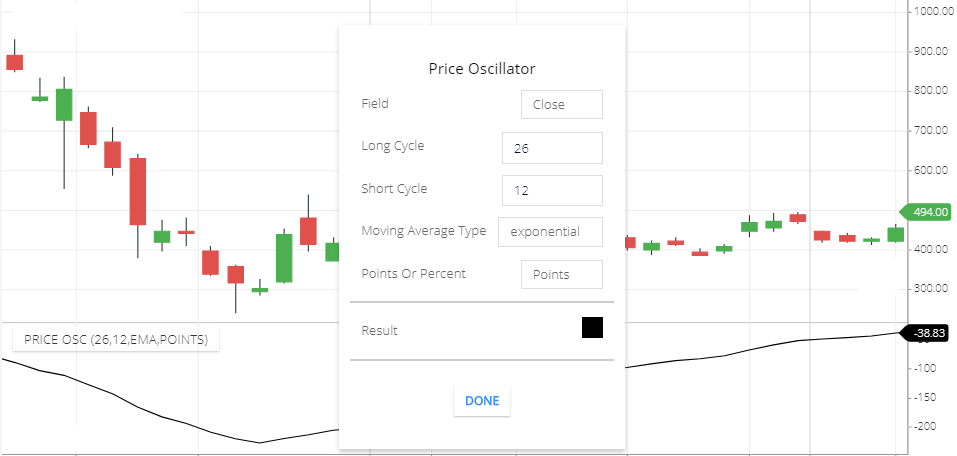
- Field: default field is ‘ close’, the period closing price will take to calculate this Indicator.
- Long Cycle: This is the period of the Long Long moving average line. The default period is 26.
- Short cycle: this is the period of the short moving average line. Default value if 12.
- Moving average type: This means the MA calculation types. The default moving average type is Exponential moving average.
- Point or Percent: this will show the difference between long and short MA values as a number or percentage of difference. By default point, means it will show the difference as a number.
- Result: the indicator line color.
price OSC indicator Calculation
- Price OSC is the difference between short and long period Moving averages.
- if the short period MA line is above the long period MA, then the indicator line will be above the zero line.
- If the short period MA line is below the Long-period MA then the indicator line will be below the zero line.
- If the two line is crossing, then Indicator line will be at the zero line.
- If the gap between the two MA line less, the indicator line will be near 0 line. And if the gap of the two-line is high, the indicator line will be far from the zero line.
Price Oscillator formula = Short period MA – Long period MA.
What this indicator tells you,
- Below the zero line is the negative side.
- Above the zero line is the Positive side.
- If the Indicator line is almost flat, this means the market is sideways
- if indicator sharply moving up or down is the trending market.
Price Oscillator Trading strategy
Strategy 1
- if the indicator moving upward direction, after crossing the zero line you can buy the share.
- If the indicator line is moving Downward direction, after crossing the zero line, take the Position of short selling.
Strategy 2
Use this indicator with combination of RSI.
Buy: if the Price OSC is moving up. and Crossing zero line. This is the buying signal in the Price OSC Indicator.
In the RSI Indicator, if the RSI live moving up and after crossing 50 line. this is the Bullish signal in RSI Indicator.
If both the indicator gives a buying signal, you can take the buying Position.
Sell: Price OSC giving sell signal after moving down below the zero line. And in the RSI indicator, below 50 is the Bearish signal. So when both the signal match, then take a short sell position.
Conclusion
Price Oscillator displays the difference between short and long Moving Averages as an Indicator line. And tells you the direction of the trend, buying selling Positions.
*Read related posts for more information.