The random walk index (RWI) indicator used to rectify the strong trend and the direction of the share price. and save traders from random stock price fluctuations.
Sometimes share price is rising of falling randomly then price reversal may be seen later but this indicator will tell you the trend random or the sign of the large trend.
Random Walk Index setting
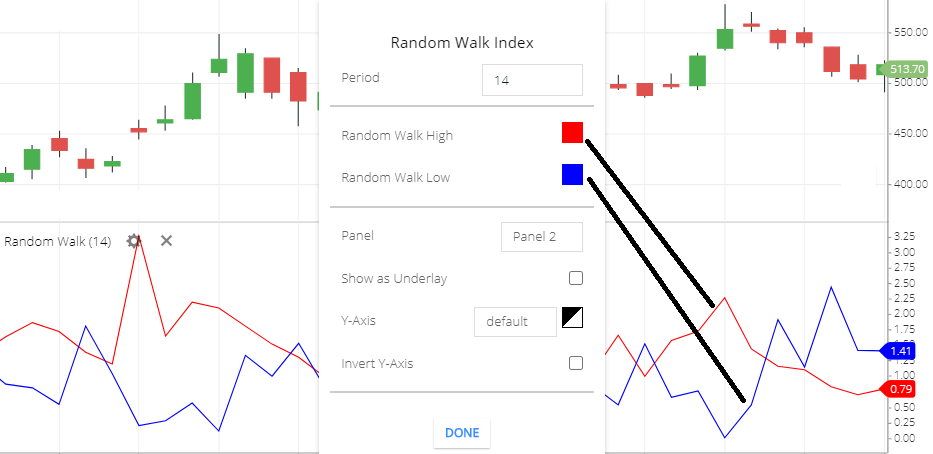
- Period: mostly all the indicator uses 14 periods as a default period. this means the specific period share price will take to calculate the random walk index indicator.
- Random Walk High: the default color of the high is RED. means increasing of the RED line indicates a positive sign in this indicator.
- Random walk low: the default color of the low is Blue in this trading software. so when the blue line is rising above the red line this is the negative sign in this indicator.
- Panel: different types of panel avail to show display this indicator.
- Y-axis: using this option you can change the right-side value bar position and color.
- Invest Y-axis: using this option you can invert the right rise value bar.
What RWI indicator tells you
- The rising of the high line ( which is RED in this trading software) indicates the positive trend of the share price.
- the rising of the low line ( which is the Blue line in this trading software) indicates the negative trend of the share price.
- also, when one of the lines of RWI indicator ( RED and Blue line) is moving around the 1 value of RWI indicator, this means the share price is randomly moving.
- if one of the lines of this indicator ( RED and Blue line) is moving around the 2 value of this indicator, this indicates the share price is changing to trend.
- if the RED or Blue line is moving around the 3 level of this indicator which indicator a strong trend of the share price.
Random walk index trading strategy
- First, you have to understand below 1 momentum of RWI indicator is leads to a random price movement. so you can avoid movement of random walk index indicator below 1.
- A buy signal is generated when the high line (RED line) of this indicator is rising above the 1.5 and the low line is below the 1, which indicate the bullish trend.
- If the Low line (Blue Line) of RWI indicator is rising above the 1.5 value of this indicator and the high line is below 1, which indicates the bearish trend of the Random walk index indicator.
The main use of the RWI indicator is finding the strong trend of the stock price. below 1 is the indication of the random price fluctuations.
Conclusion
Random Walk Index indicator is to help you to find a strong trend with the direction of the trend. in the share market lots of false trends you may have seen, some trader may be trapped by that false trend that’s why the RWI indicator uses to rectifying the strong trend in the share price.
*Read Related Post For More Information.