In a simple word, the stochastic divergence indicates the divergence of the Stochastics indicator.
Explanation: When the share price and the indicator movement in the opposite direction then this indicator will draw a divergence line. so that you will understand what when the indicator is not following the share price direction.
Stochastic Divergence setting
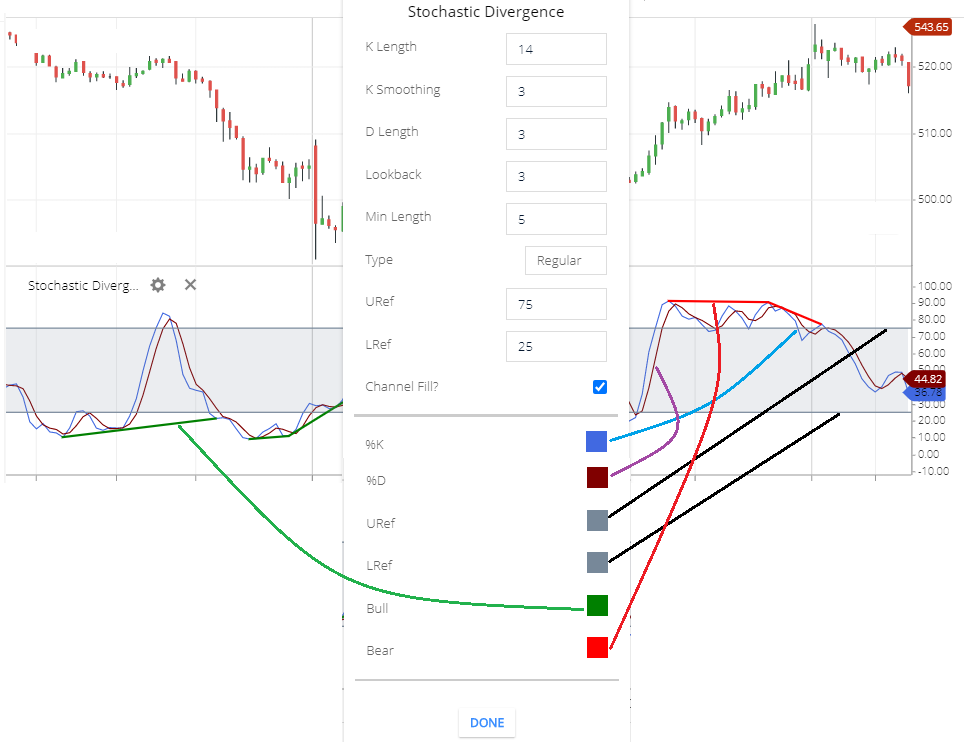
- K Length: Default K length is 14.
- K Smoothing: the k smoothing is 3.
- D length: D length is 3.
- Lookback: Lookback also 3.
- Min Length: Min length is 5.
- Type: type is Regular.
- URef: This is the overbought level of this indicator. The URef level is 75.
- LRef: this is the oversold level of this indicator. The LRef level is 25.
- Channel Fill: this is the channel fill. It will fill the gap between 75 to 25 by the color.
- %K: this is the color of the %K line.
- %D: this is the %D line color.
- URef: this is the upper reference line color.
- LRef: lower reference line color.
- Bull: this is the bullish divergence line color.
- Bear: this is the bearish divergence line color.
What Stochastic Divergence indicator tells you
The main use of this indicator is, the Stochastics indicator is integrated with this, and tells you the divergence of the stochastics indicator.
Divergence means the share price and the indicator moving direction is opposite to each other.
Sometimes very small divergence cannot be detected manually but this will draw a divergence line, and that will be very good to find divergence.
When the Bearish divergence occurs then the Red line will draw on the indicator lines. when the bullish divergence occurs then the Green line will draw on the indicator lines.
Stochastic Divergence Trading strategy
Strategy 1
Mainly this use to find the divergence.
Bearish divergence: when the share price is rising and touching higher high and the indicator is not touching higher high. this is the bearish divergence. and this is the possibility that share price can fall. if the share price starts falling then you can take a short-selling position.
And the Red line will draw on the indicator lines when the Bearish divergence occurs.
Bullish divergence: when the share price is falling and touching lower low and the indicator isn’t touching lower low. This is the bullish divergence. This is the indication that share prices can rise. If the share price started rising you can take buy Position.
Strategy 2
although it’s used for divergence, it also can give you the trend direction.
Bullish direction: when the Blue line (%k line) is above the Red line (%D Line). this indicates the trend is in the bullish direction.
Bearish direction: when the Red line (%D line) is above the Blue line (%k line). this indicates the bearish trend.
Strategy 3
When the indicator lines are above the URef line, this is the overbought zone. and reversal of share price may soon. if the share price started reversing (means falling) then take a short sell position.
When the indicator lines are below the LRef line, this the oversold zone. and the reversal of the stock price may soon. if the stock price is started reversing ( means rising) then you can take a buy position.
Conclusion
The main use of the stochastic divergence indicator is, it helps you to find a divergence of the share price and the indicator lines. whenever the divergence occurs the indicator will draw a divergence line. also, you can take trades to see trend direction and the buying and the selling signal.
*Read Related Post For More Information.